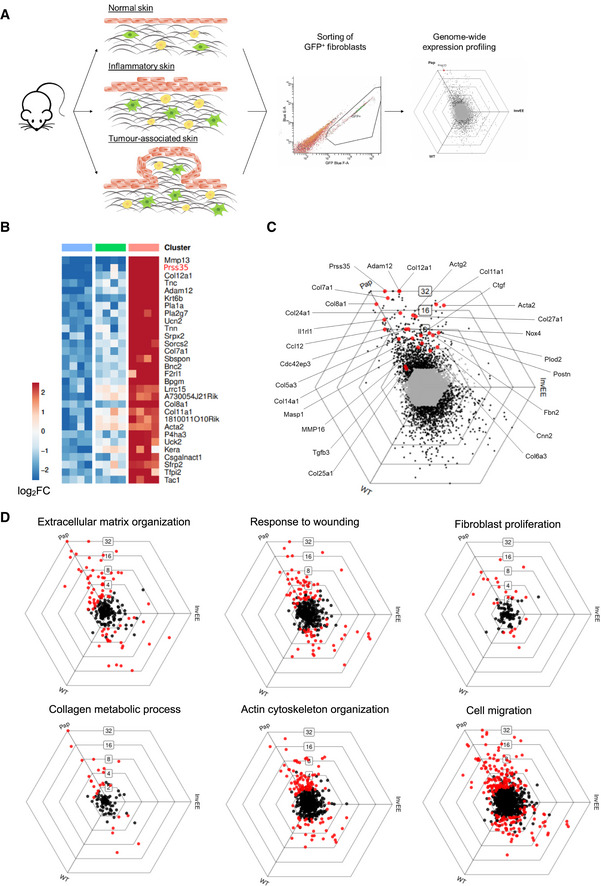
Figure 1. Dermal CAFs from wound‐induced tumours exhibit a fibrotic gene signature.

- Schematic representation of experimental set‐up for genome‐wide fibroblast expression profiling.
- Heat map depicting mean expression of the top 20 upregulated genes of fibroblast isolated from wound‐induced tumours (Pap) compared to fibroblasts from wild‐type (WT) and inflamed (InvEE) back skin (n = 3 per condition). PRSS35 is indicated in red as a top upregulated gene in CAFs.
- To visualize DEGs between subsets of fibroblasts sorted from homeostatic (WT), inflamed (InvEE) or tumour‐associated (Pap) skin, each gene was plotted in a hexagonal triwise diagram in which the position of a point represents the relative increased expression in one or two populations, whereas the distance from the origin represents the magnitude of expression. Genes that are 32‐fold or more upregulated are plotted on the outer grid line. Grey dots in the centre of the triwise plot represent genes that are not differentially expressed. Genes associated with a fibrotic response are depicted in red.
- Hexagonal triwise plots of genes belonging to the respective gene ontology (GO) term, which were among the highest upregulated GO terms. Dots in red represent genes that are differentially expressed between the three conditions.
