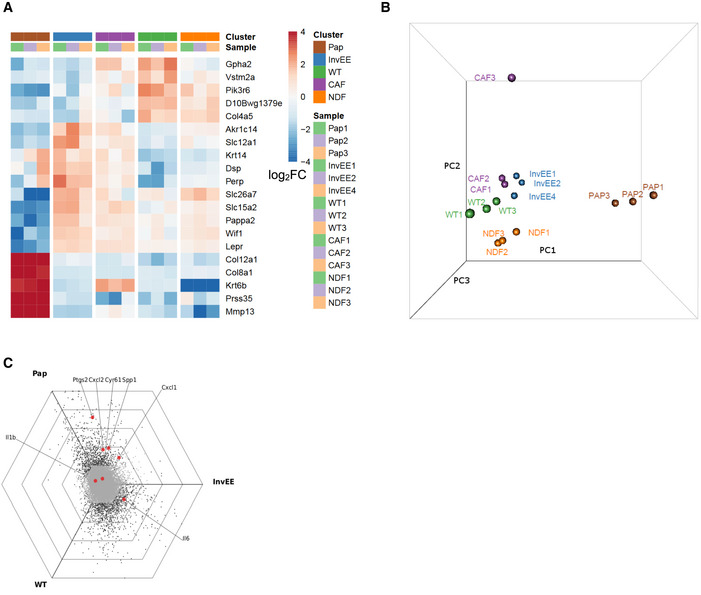
Figure EV1. Comparison of the InvEE CAF signature with the pro‐inflammatory CAF signature characterized by Erez et al(2010).

- Combined clustering of our dataset (WT: normal skin, InvEE: inflammatory skin and Pap: wound‐induced papillomas) and the dataset obtained by Erez et al (NDF: normal dermal fibroblasts and CAF: cancer‐associated fibroblasts) based on global differential gene expression.
- Principle component analysis of our dataset and the dataset from Erez et al purple: CAF, orange: NDF, blue: InvEE, green: WT and brown: Pap).
- Hexagonal triwise plot showing the pro‐inflammatory gene signature, determined by Erez et al and mapped on our gene expression analysis. (Ptgs2 = Cox2, SPP1 = Osteopontin, Cyr61 = CCN1).
