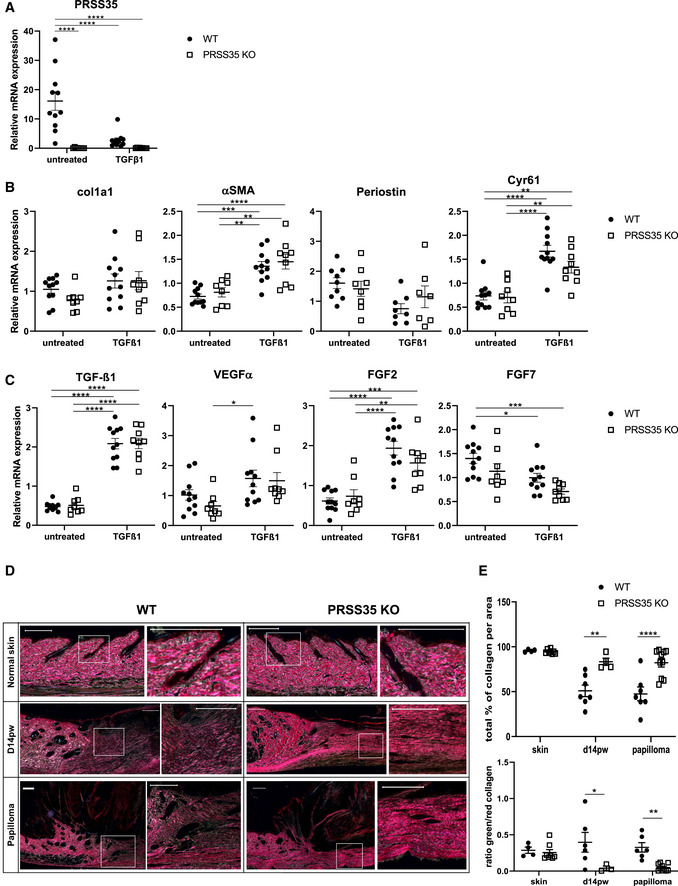
Relative mRNA expression levels of PRSS35 in primary fibroblast cultures isolated from WT and PRSS35 KO mice, untreated or after 24 h stimulation with 10 ng/ml TGF‐β1 (n > 8 biological replicates per condition) (****P < 0.0001; two‐way ANOVA with multiple comparisons). Data represent means of three technical replicates ± SEM.
Relative mRNA expression levels of the indicated ECM genes in primary fibroblast cultures (col1a1: collagen type 1 alpha 1; αSMA, alpha‐smooth muscle actin; Cyr61: Cysteine‐rich angiogenic inducer 61 (=CCN1)) in primary fibroblast cultures isolated from WT and PRSS35 KO mice, untreated or after 24 h stimulation with 10 ng/ml TGFβ1 (n ≥ 7 biological replicates per condition) (**P < 0.01, ***P < 0.001, ****P < 0.0001; two‐way ANOVA with multiple comparisons). Data represent means of three technical replicates± SEM.
Relative mRNA expression levels of the indicated cytokines/growth factors in primary fibroblast cultures (n ≥ 8 per condition) (VEGF‐α, vascular endothelial growth factor‐alpha; FGF2: basic fibroblast growth factor; FGF7: keratinocyte growth factor) (*P < 0.05, **P < 0.01, ***P < 0.001, ****P < 0.0001; two‐way ANOVA with multiple comparisons). Data represent means of three technical replicates ± SEM.
Picrosirius red staining of normal skin, day 14 post‐wounding (d14pw) skin or wound‐induced papillomas from WT and PRSS35 KO mice. Red colouring indicates thick fibres, green colouring indicates thin fibres. Scale bars: 200 µm.
Quantification of picrosirius red staining as total collagen density (upper panel) and ratio of red versus green picrosirius staining (lower panel). Using QuPath Bioimage analysis software pixels colouring red or green were determined per area. (n ≥ 4 technical replicates per condition) (*P < 0.05, **P < 0.01, ****P < 0.0001; two‐way ANOVA with multiple comparisons). Data represent means ± SEM.

