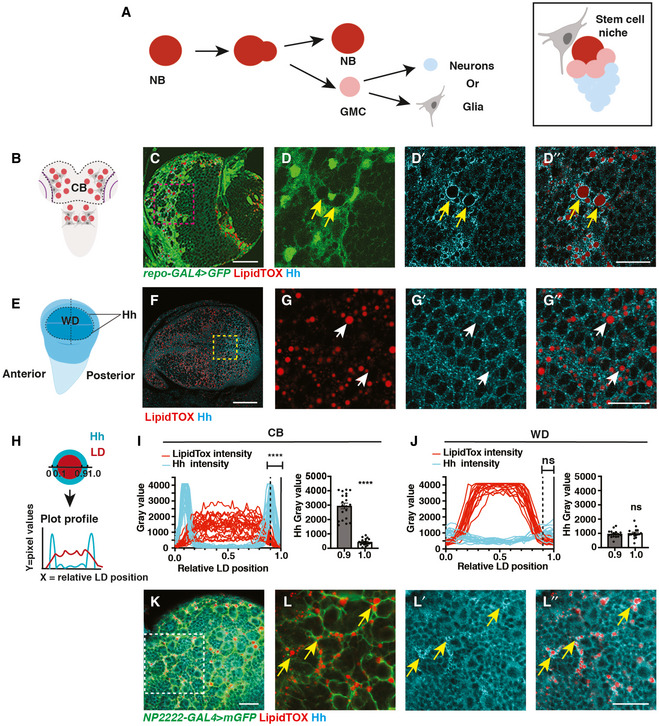
Figure 1. Hh is localised to the LDs within cortex glial cells.

-
ASchematic showing NBs that undergo asymmetric division to self‐renew and produce GMCs, which terminally differentiate to generate post‐mitotic neurons or glial cells (left). Each NB is surrounded by a microenvironment, composed of glial cells (right).
-
B–D”Representative images showing that Hh accumulates on the surface of LDs in glial cells of the CB (yellow arrows), quantified in (I) (n = 20 LDs). Glial cells are marked by repo‐GAL4 > GFP and CB is circled in (B).
-
E–G”In the posterior compartment of the developing wing disc (WD) pouch region where Hh is expressed, LDs and Hh are not tightly associated (white arrows), quantified in (J) (n = 17 LDs).
-
H–JHh‐LD association is quantified by plotting the pixel intensities of both Hh (cyan) and LDs (red) along a line across LDs. Y‐axis represents grey intensity values, and X‐axis represents relative LD position.
-
K, L”Hh‐LD associations are observed in the cortex glia (yellow arrows, NP2222‐GAL4 > mGFP).
Data information: Hh is detected with a Hh antibody and LDs are visualised with LipidTOX unless otherwise stated. (D‐D’’), (G‐G’’), (L‐L’’) are zoomed in images of (C, F, K), respectively. Scale bar = 50 μm in (C and F), scale bar = 20 μm in (D‐D’’, K‐L’’), scale bar = 10 μm in (G‐G’’). Error bar represents SEM. In (I): Welch’s t‐test, (****) P < 0.0001. In (J): unpaired t‐test, (ns) P = 0.7113.
Source data are available online for this figure.
