
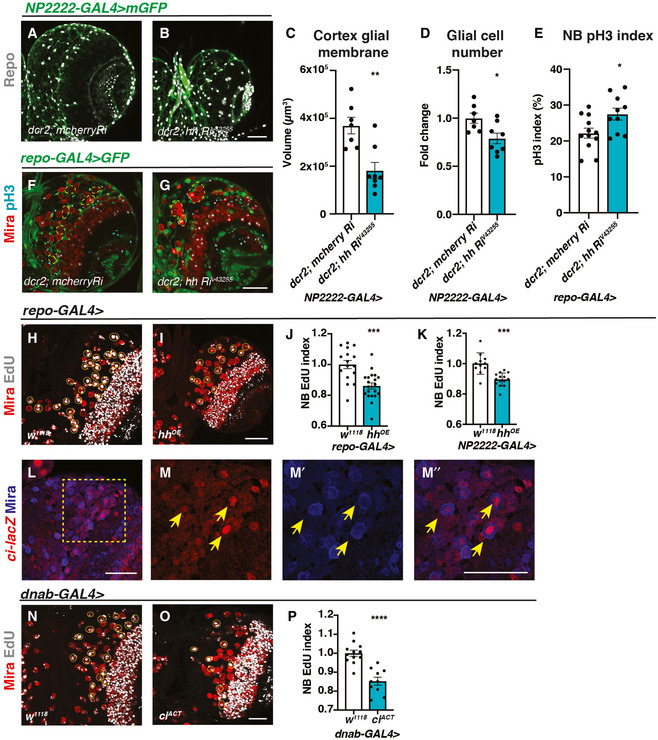
Figure 2. Hh autonomously regulates cortex gliogenesis and non‐autonomously regulates NB proliferation.
-
A–DRepresentative images showing that upon knockdown of Hh in cortex glial cells (NP2222‐GAL4 > mGFP with UAS‐dcr2), cortex glial membrane and overall Repo + glial cell number are significantly reduced, quantified in (C) (n = 7, 8 brain lobes) and (D) (n = 7, 8 brain lobes), respectively.
-
E–GHh knockdown in glia (repo‐GAL4 > GFP) results in niche disruption and clustering of NBs (circled with yellow dashed line), as well as an increase in the percentage of NBs in M phase (pH3+), quantified in (E) (n = 12, 10 brain lobes).
-
H–KRepresentative images showing that Hh overexpression using pan‐glial (repo‐GAL4) and cortex glial (NP2222‐GAL4) drivers both result in a decrease in NB EdU index, quantified in (J) (n = 16, 20 brain lobes) and (K) (n = 11, 14 brain lobes), respectively.
-
L–M”Representative images showing ci‐lacZ is expressed in NBs (yellow arrows). (M‐M’’) are zoomed in images of (L).
-
N–POverexpression of ciACT in NBs (dnab‐GAL4) reduces EdU index, quantified in (P) (n = 12, 10 brain lobes).
Data information: NBs are marked with Mira and EdU+ NBs are circled by yellow dashed line. Scale bar = 50 μm. Error bar represents SEM. In (C): Mann–Whitney test, (**) P = 0.0059. In (D): unpaired t‐test, (*) P = 0.0176. In (E): unpaired t‐test, (*) P = 0.0215. In (J): unpaired t‐test, (***) P = 0.0002. In (K): unpaired t‐test, (***) P = 0.0001. In (P): unpaired t‐test, (****) P < 0.0001.
Source data are available online for this figure.