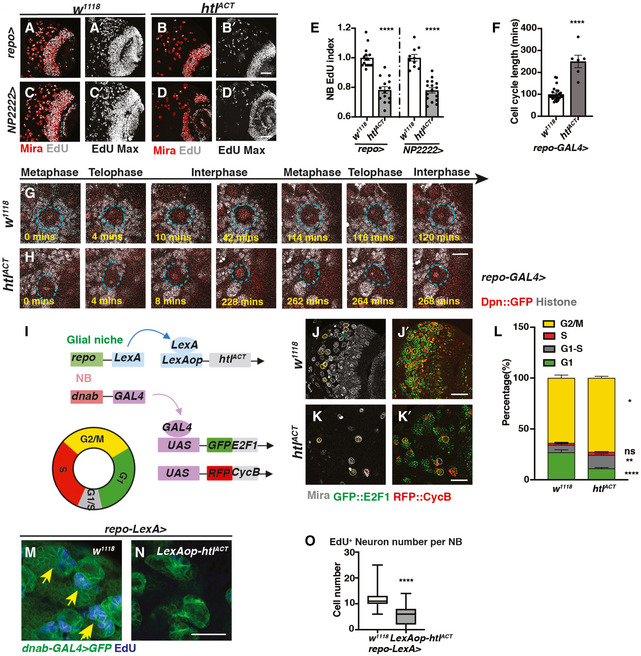
Figure 5. Cortex glial overgrowth mediated by htlACT overexpression triggers NB cell cycle delay.

-
A–ERepresentative images showing that both pan‐glial (repo‐GAL4>) and cortex glial (NP2222‐GAL4>) htlACT overexpression significantly reduce NB EdU index, quantified in (E) (n = 15, 14; 10, 16 brain lobes). (A, B, C, D) are single sections with Mira and EdU staining, and (A’, B’ C’, D’) are Z‐projection of the EdU staining.
-
F–HRepresentative still images from ex vivo CNS live imaging at 72ALH showing that pan‐glial (repo‐GAL4) htlACT overexpression lengthens NB cell cycle, quantified in (F) (n = 25, 6 NBs imaged from three brains per genotype). The cell cycle length is measured as the length between consecutive divisions. NBs (Dpn::GFP, red; Histone RFP, grey) are circled with blue dashed lines.
-
ISchematic depicting concurrent glial FGF activation (repo‐LexA > LexAop‐htlACT), and NB overexpression of fly‐FUCCI (dnab‐GAL4 > UAS‐GFP::E2F1, UAS‐RFP::CycB). The fly‐FUCCI system utilises the fusion protein GFP::E2F1 (a marker for cells in G2, M and G1 phase) and RFP::CycB ( a marker for cells in S, G2, M phase) to monitor cell cycle progression. Cells in G1 phase are GFP+ RFP‐ (green), cells in G2/ M phase are GFP+RFP+ (yellow), and cells in S phase are GFP‐RFP+ (red), whereas cells in G1‐S transition are weakly labelled by both GFP and RFP (grey).
-
J–LRepresentative images showing that the percentage of NBs in G1‐S transition and G2/M phase are both significantly increased with significantly less cells remaining in G1 phase, quantified in (L) (n = 9, 10 brain lobes). NBs in G1 phase (Mira+, GFP+) are circled by green dashed lines; NBs in G1‐S transition (Mira+, GFP‐RFP‐) are circled by grey dashed lines; NBs in S phase (Mira+, RFP+) are circled by red dashed lines, and NBs in G2/M phase (Mira+, GFP+RFP+) are circled by yellow dashed lines.
-
M–ORepresentative images showing that the number of EdU+ neurons generated per NB is significantly reduced upon pan‐glial overexpression of FGF (repo‐LexA > LexAop‐htlACT; yellow arrows), quantified in (O) (Box plot, the boxes extend from the 25th to 75th percentiles; the median is marked by a central band inside the box; and the whiskers go down to the minimum value and up to the maximum value. n = 94, 127 NB lineages imaged from five and seven brain lobes, respectively). NB lineages are marked with dnab‐gal4 > GFP.
Data information: Scale bar = 50 μm in (A–D’, J–K’); Scale bar = 10 μm in (G, H); Scale bar = 20 μm in (M, N). Error bar represents SEM unless otherwise stated. In (E): unpaired t‐test, (****) P < 0.0001; unpaired t‐test, (****) P < 0.0001. In (F): Mann–Whitney test, (****) P < 0.0001. In (L): G1: Mann–Whitney test, (****) P < 0.0001; G1‐S: unpaired t‐test, (**) P = 0.0064; S: unpaired t‐test, (ns) P = 0.1757; G2/M: unpaired t‐test, (*) P = 0.0171. In (O): Mann–Whitney test, (****) P < 0.0001.
Source data are available online for this figure.
