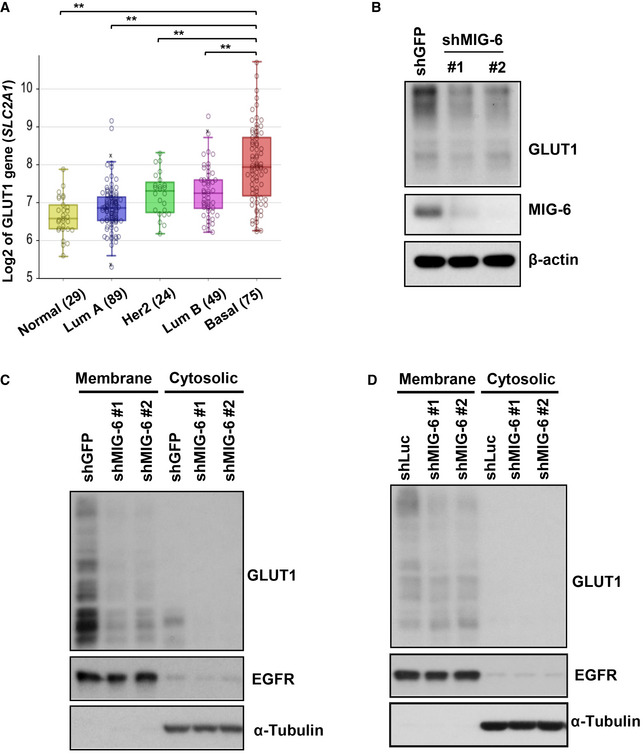
Figure EV4. MIG‐6 depletion reduces the expression of GLUT1.

- Box plots show the GLUT1 (SLC2A1) gene expression in different breast tumor subtypes in the Bertucci dataset of 266 primary breast cancer carcinomas, analyzed using Illumina HumanWG‐6_v3 Arrays. The gene expression levels are determined using the R2 platform. In the box plot, error bars are the 95% confidence interval, the bottom and top of the box are the 25th and 75th percentiles, the line inside the box is the 50th percentile (median), and any outliers are shown as open circles. **P < 0.01, by Student’s t‐test.
- Immunoblotting analysis for GLUT1 protein expression in MDA‐MB‐231 cells with GFP or MIG‐6 knockdown.
- Immunoblotting analysis for GLUT1 expression in the membrane and cytosolic fractions in BT549 cells with GFP or MIG‐6 knockdown. EGFR and α‐Tubulin served as markers for membrane and cytosolic fractions, respectively.
- Immunoblotting analysis for GLUT1 expression in the membrane and cytosolic fractions of MDA‐MB‐231 cells with Luciferase or MIG‐6 knockdown.
