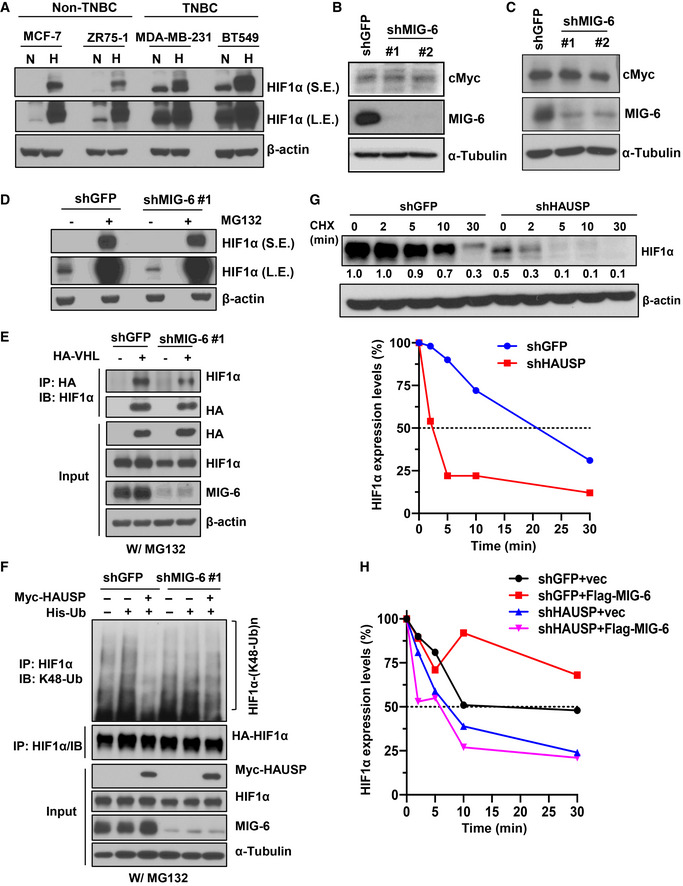
Immunoblotting analysis for HIF1α expression in various breast cancer cells under normoxia (N) and hypoxia (H).
Immunoblotting analysis for cMyc protein expression in BT549 cells with GFP or MIG‐6 knockdown.
Immunoblotting analysis for cMyc protein expression in MDA‐MB‐231 cells with GFP or MIG‐6 knockdown.
Immunoblotting analysis for HIF1α expression in response to MG132 treatment in BT549 cells with GFP or MIG‐6 knockdown.
GFP and MIG‐6 knockdown BT549 cells transfected with the indicated plasmids were treated with MG132, subjected to immunoprecipitation with the HA‐tag antibody, followed by immunoblotting analysis.
Luciferase and MIG‐6 knockdown BT549 cells were transfected with the indicated plasmids and subjected to MG132 treatment. Afterward, cells were harvested for IP with the HIF1α antibody, followed by immunoblotting analysis to determine the level of K48‐linked ubiquitination of HIF1α.
The upper panel shows an immunoblotting analysis for the half‐life of the HIF1α protein in BT549 cells with GFP or HAUSP knockdown upon cycloheximide (CHX) treatment. The relative intensities of HIF1α protein expression are quantified by ImageJ software and normalized to that in shGFP cells without CHX. The lower panel shows the quantitative results for the half‐life of the HIF1α protein in BT549 cells with GFP or HAUSP knockdown. The relative intensities of HIF1α protein expression quantified by ImageJ software are normalized to that in shGFP or shHAUSP cells without CHX treatment. The dotted line indicates 50% abundance of HIF1α, and the half‐life (t
1/2) HIF1α protein.
Quantitative result for the half‐life of the HIF1α protein upon MIG‐6 overexpression in BT549 cells with GFP or HAUSP knockdown upon CHX treatment. The relative intensities of HIF1α protein expression quantified by ImageJ software are normalized to that in each group without CHX treatment. The dotted line indicates 50% abundance of HIF1α, and the half‐life (t
1/2) HIF1α protein.

