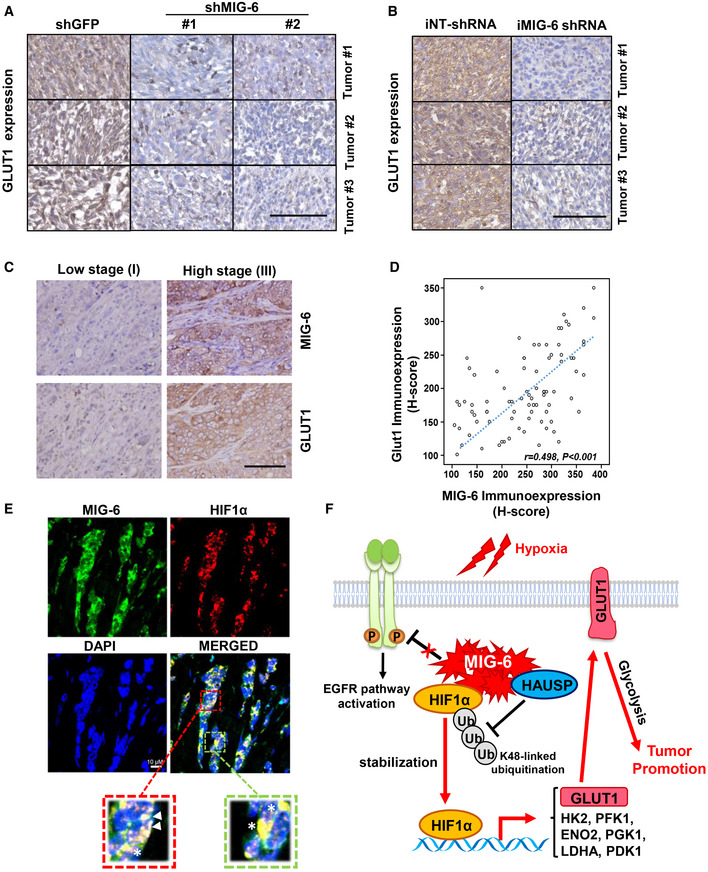
Figure 8. MIG‐6 deficiency inhibits GLUT1 protein expression in vivo .

- Representative images of histological analysis for GLUT1 protein expression in BT549‐derived xenograft tumors. Scale bar, 100 μm.
- Representative images of histological analysis for GLUT1 protein expression in xenograft tumors derived from BT549 cells containing iNT‐shRNA and iMIG‐6‐shRNA. Scale bar, 100 μm.
- Representative images of histological analyses for GLUT1 and MIG‐6 expressions in TNBC patients in low‐grade (stage I) and high‐grade (stage III) tumors Scale bar, 200 µm.
- Scatterplot analysis for the correlation between GLUT1 and MIG‐6 expression levels (n = 85). The r value was calculated by Spearman’s rank correlation coefficient analysis.
- Representative images of the immunofluorescence multiplex assay for colocalization of MIG‐6 and HIF1α protein expression in TNBC tumor specimens. The triangle indicates nuclear colocalization, and the star indicates cytoplasmic colocalization.
- A working model depicts the mechanism by which MIG‐6 exerts its tumor‐promoting function in TNBC. MIG‐6 overexpression promotes HIF1α stabilization and the subsequent upregulation of GLUT1 gene transcription, metabolic reprogramming, and tumorigenesis.
