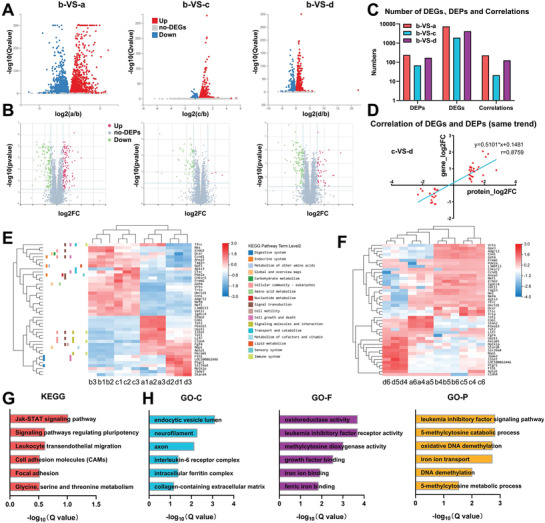
Figure 3.

LIF signaling pathway, DNA demethylation, and iron ion transport differs significantly between the MgFe‐LDH and MgAl‐LDH groups, as identified via combined transcriptomic and proteomic analysis. A) Volcano plot of DEGs. B) Volcano plot of DEPs. C) The number of DEGs, DEPs, and correlations were quantified. a, b, c, and d represent the LIF+, LIF‐, MgAl‐LDH, and MgFe‐LDH groups, respectively. D) Correlation analysis of 44 DEGs and DEPs that had similar trends between c) the MgAl‐LDH and d) MgFe‐LDH groups. E) Heatmap of these 44 DEGs from correlation analysis, colors indicating relative expression. F) Clustering analysis of these 44 DEPs from the correlation analysis. G) KEGG pathway analysis of these 44 DEGs. H) GO enrichment analysis of these 44 DEGs.
