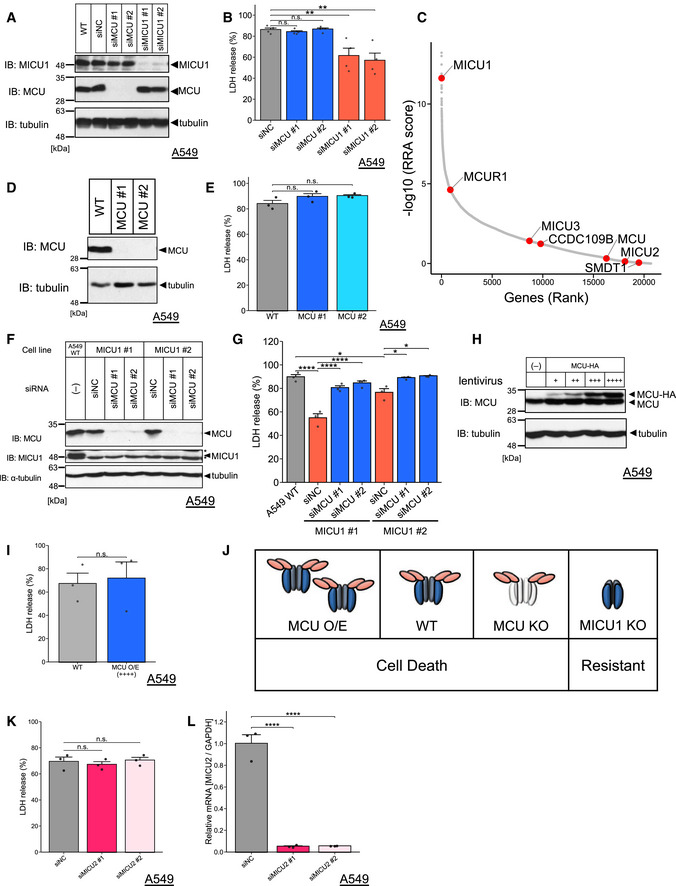
Immunoblots of endogenous MICU1 or MCU signals after siRNAs transfection in the WT A549 cells.
LDH release was measured after cold stress for 24 h. Data are presented as mean ± SEM; n = 4 (B), biological replicates, **P < 0.01, n.s.: not significant, one‐way ANOVA followed by Dunnett’s test.
Components of the MCU complex (MCU, MCUR1, MCUb (CCDC109B), MICU1, MICU2, MICU3, and EMRE (SMDT1)) are highlighted in red in the RRA score plot calculated by the MAGeCK program.
Immunoblots of endogenous MCU signals after Cas9/sgRNA lentivirus infection in the WT A549 cells.
LDH release was measured after cold stress for 24 h. Data are presented as mean ± SEM; n = 3, biological replicates, n.s.: not significant, one‐way ANOVA followed by Dunnett’s test.
Immunoblots of endogenous MICU1 or MCU signals after siRNAs transfection in the WT A549 cells and MICU1‐KO cells.
LDH release was measured after cold stress for 24 h. Data are presented as mean ± SEM; n = 3, biological replicates, ****P < 0.0001, *P < 0.05, one‐way ANOVA followed by Tukey’s test.
Immunoblots of endogenous and overexpressing MCU signals after MCU‐HA lentivirus infection in the WT A549 cells.
LDH release was measured after cold stress for 24 h. Data are presented as mean ± SEM; n = 3, biological replicates, n.s.: not significant, unpaired t‐test.
Schematic model for MICU1 and MCU expression and its effect on cell death induced by cold stress.
LDH release was measured after cold stress for 16 h. Data are presented as mean ± SEM; n = 3, biological replicates, n.s.: not significant, one‐way ANOVA followed by Dunnett’s test.
MICU2 mRNA was quantified by RT–qPCR. Data are presented as mean ± SEM; n = 3, biological replicates, ****P < 0.0001, one‐way ANOVA followed by Dunnett’s test.