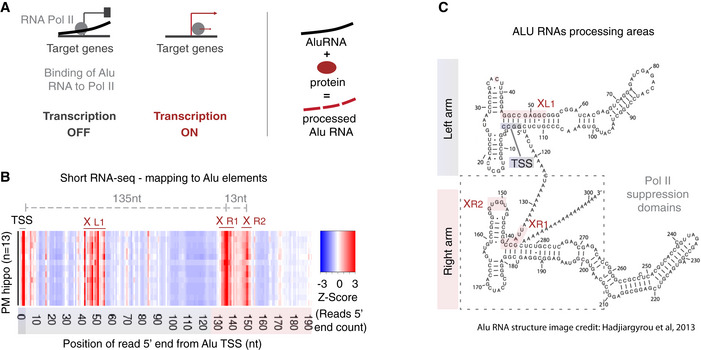
Figure 1. Processing areas of Alu RNAs in the human hippocampus as revealed by short RNA‐seq.

- Mode of regulation of transcription by Alu RNAs through suppression of RNA polymerase II (left panel) and protein‐accelerated self‐cleaving processing properties of Alu RNAs (right panel) as described in previous studies (Mariner et al, 2008; Yakovchuk et al, 2009; Ponicsan et al, 2010; Hernandez et al, 2020).
- Plotting of the position of the 5′ end of Alu RNA fragments across the Alu metagene to depict potential processing areas of Alu RNAs in all post‐mortem hippocampal tissues (PM hippo) from patients from the CBB. Each row in the heatmap depicts the distribution of counts of the 5′ ends of reads mapped across the Alu metagene for each patient. The x‐axis represents a metagene combining all unique Alu RNA sequences (ALUome) aligned at the start site of their consensus sequence with numbers representing the distance from the transcriptional start site (TSS) area. Heatmap density corresponds to normalized counts of the 5′ end of the reads with red corresponding to higher density of these 5′ ends at a specific position. XL1, XR1, and XR2 denote the Alu processing areas defined by the high‐density areas in the heatmap at specific positions of the Alu metagene, with the middle letter corresponding to the arm of the Alu RNA (see C, L = left, R = right), in which the area is located.
- Processing areas of Alu RNAs on the secondary Alu RNA structure. Secondary structure of Alu RNA adapted from Hadjiargyrou and colleagues (Hadjiargyrou & Delihas, 2013). As in our previous studies (Zovoilis et al, 2016; Cheng et al, 2020), we depict the SINE RNA processing areas (highlighted in pink) based on short RNA‐seq data and mapping of the 5′ ends of Alu RNA fragments. X mark the cleavage sites of Alu RNA that correspond to enriched processing areas (the high densities of 5′ end fragments distribution) at the heatmap of (B). The rectangle depicts the critical region that binds and suppresses RNA Pol II based on (Mariner et al, 2008) that may be affected due to processing points.
