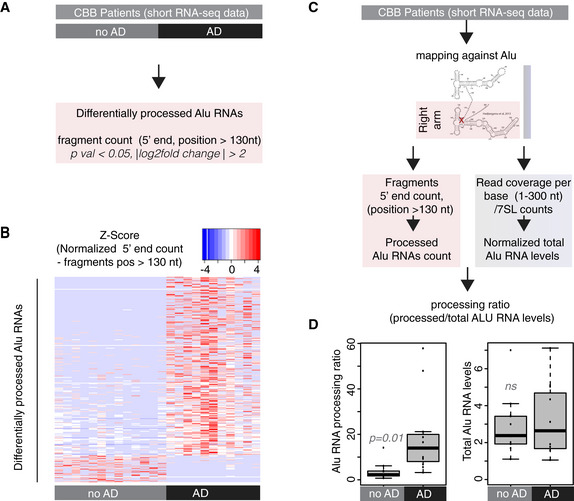
Figure 2. Alu RNA processing ratio is increased in the hippocampi of AD patients in CBB cohort.

- Analysis design for the identification of differentially processed Alu RNAs between no AD (n = 13) and AD (n = 11) patients of the CBB cohort using the DESeq2 R package. Statistical significance was estimated using the Wald significance tests within the DESeq2 package.
- Normalized counts of processed fragments mapping to the right arm of Alu RNAs that are differentially processed (rows) between AD and no AD for each CBB patient (columns) (Dataset EV1). Red corresponds to higher normalized counts of processed Alu RNA fragments.
- Analysis design for calculation of the Alu RNA processing ratio in CBB patients short RNA‐seq data.
- Boxplots depict differences in hippocampi of AD and no AD patients regarding SINE Alu RNA processing ratio (left panel) (a P value of 0.05 was considered as threshold for statistical significance with P = 0.01, n = 24, unpaired non‐directional t‐test) and in total Alu RNA levels (right panel) (ns = not significant). In the boxplots, the central band (the line that divides the box into 2 parts) represents the median of the data, the ends of the box show the upper (Q3) and lower (Q1) quartiles, the extreme line shows Q3 + 1.5 × IQR to Q1 − 1.5 × IQR (the highest and lowest value excluding potential outliers), while dots beyond the extreme line show potential outliers.
