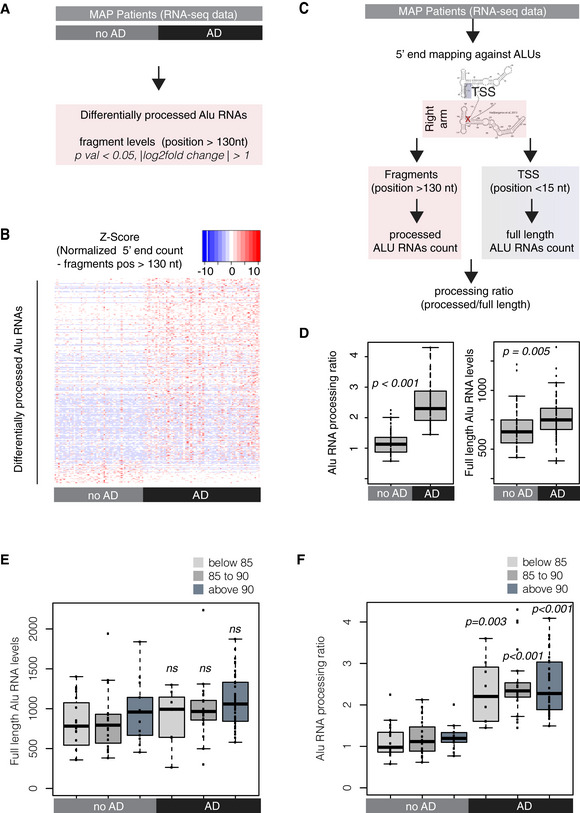
Analysis design for the identification of differentially processed Alu RNAs between AD (n = 67) and no AD patients (n = 51) of the MAP cohort using the DESeq2 R package. Statistical significance was estimated using the Wald significance tests within the DESeq2 package.
As in Fig
2B, normalized counts of processed fragments mapping to the right arm of Alu RNAs that are differentially processed (rows) between AD and no AD for each MAP patient (columns) (Dataset
EV2). Red corresponds to higher normalized counts of processed Alu RNA fragments.
Analysis design for calculation of the Alu RNA processing ratio in MAP patients’ RNA‐seq data.
Boxplots depict differences in cortex of AD and no AD patients regarding SINE Alu RNA processing ratio (left panel) (a P value of 0.05 was considered as threshold for statistical significance with P < 0.001, n = 118, unpaired non‐directional t‐test) and in full‐length Alu RNAs (P = 0.005). Boxplot representation as in subfigure 2D.
Boxplots depict full‐length Alu RNA levels in cortex of AD and no AD patients separated into three age groups. No significant difference observed between the different age groups of either AD or no AD patients or for the comparisons between no AD and AD of each age group (unpaired non‐directional t‐test, with P < 0.05 considered the threshold for statistical significance, n for no AD = 19 (below 85), 19 (between 85–90), 13 (above 90); n for AD = 8 (below 85), 21 (between 85–90), 38 (above 90)). Boxplot representation as in subfigure 2D.
Boxplots depict differences in SINE Alu RNA processing ratio in cortex of AD and no AD patients separated into three age groups. No significant difference observed between the different age groups of either AD or no AD patients. A P value 0.05 was considered as threshold for statistical significance for the comparisons between no AD and AD of each age group (unpaired non‐directional t‐test, with P = 0.003 for the comparison below 85, and P < 0.001 for the other two comparisons and n numbers as in (E)). Boxplot representation as in subfigure 2D.

