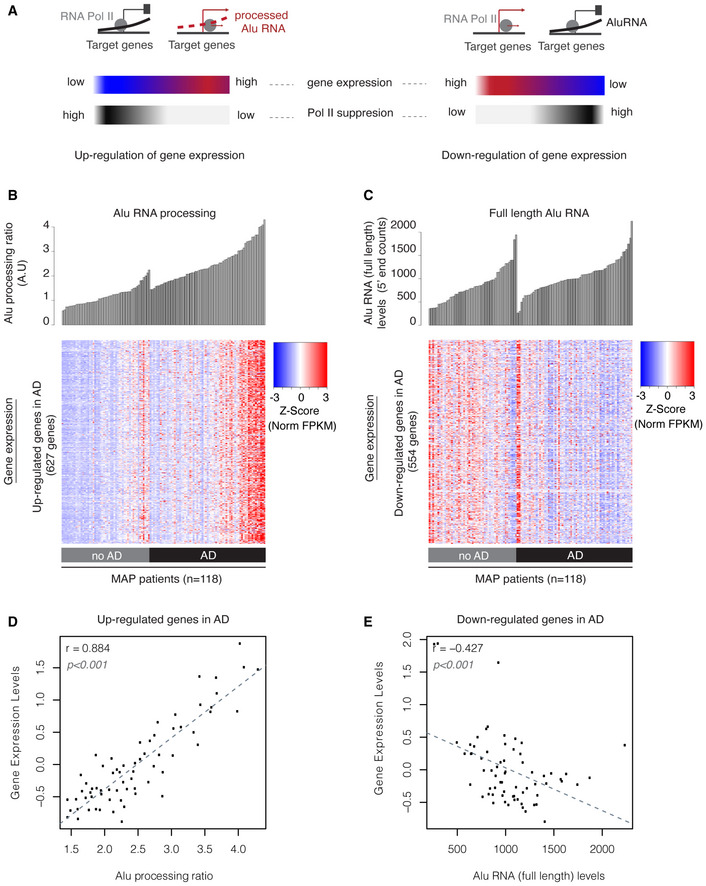
Figure 6. Alu RNA expression and processing levels are associated with transcriptome changes in the cortex of MAP patients.

- Graphical representation of the expected transcriptome changes with regard to Alu RNA expression and processing levels based on previous findings in mouse (Appendix Fig S1) and prior reports on the ability of Alu RNAs to control transcription (Mariner et al, 2008; Yakovchuk et al, 2009; Ponicsan et al, 2010) and become self‐cleaved (Hernandez et al, 2020).
- Association between SINE Alu RNA ratio (upper panel) and gene expression levels (lower panel) of genes up‐regulated in AD (Dataset EV3, |log2FoldChange| > 0.5). Every column in both panels corresponds to the same MAP patient of either the no AD or AD group. Patients in each group are sorted from left to right in an ascending order with regard to Alu RNA processing ratio. Every row in the heatmap corresponds to one gene, with color density representing normalized FPKM values from RNA‐seq for this gene for each patient (columns) (red represents high and blue low expression levels).
- Association between full‐length Alu RNA levels (upper panel) and gene expression levels (lower panel) of genes down‐regulated in AD (Dataset EV4, |log2FoldChange| > 0.5). Every column in both panels corresponds to the same MAP patient of either the no AD or AD group. Patients in each group are sorted from left to right in an ascending order with regard to full‐length Alu RNA levels. Every row in the heatmap corresponds to one gene, with color density representing normalized FPKM values from RNA‐seq for this gene for each patient (columns) (red represents high and blue low expression levels).
- Scatterplot depicting the positive correlation between average gene expression values of up‐regulated genes in Fig 6B and Alu RNA processing ratio in AD patients (r = 0.88, P < 0.001). Statistical test is based on Pearson’s product moment correlation coefficient and follows a t distribution using the cor.test function in R package stats.
- Scatterplot depicting the negative correlation between average gene expression values of down‐regulated genes in Fig 6C and full‐length Alu RNA levels in AD patients (r = −0.42, P < 0.001). Statistical test as in subfigure 6D.
