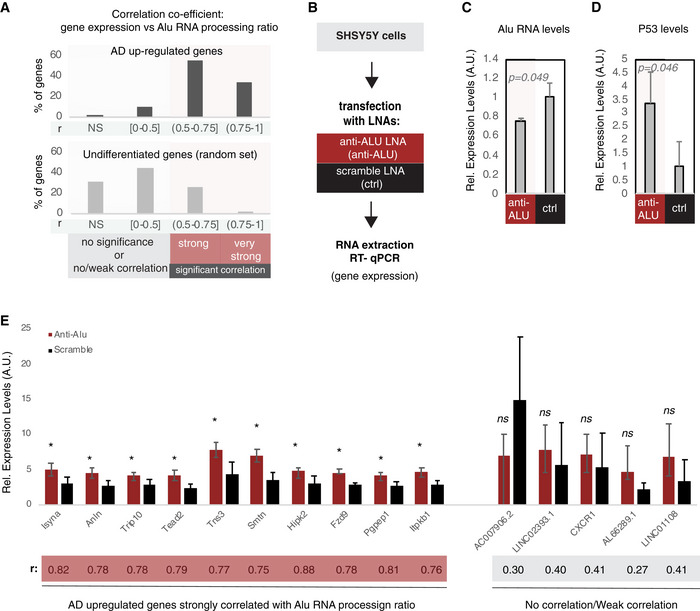
Figure 7. Alu RNA destabilization leads to increase in expression of Alu RNA processing correlated genes.

- Correlation between gene expression and Alu RNA processing ratio for AD up‐regulated genes (Dataset EV3) (upper panel) and a random set of non‐differentially expressed genes (Dataset EV5) (lower panel). For every gene, a correlation coefficient was calculated (Pearson correlation) together with the respective P‐value. Statistical test is based on Pearson’s product moment correlation coefficient and follows a t distribution using the cor.test function in R package stats. Based on the r and P value, genes were classified into four categories: (i) NS, non‐significant for P value > 0.05, (ii) no correlation or weak correlation (r ≤ 0.05), (iii) significant (P < 0.05) and strong correlation (0.5 < r ≤ 0.75), and (iv) significant (P < 0.05) and very strong correlation (0.75 < r). The bar graphs represent the percentage of each category for each set of genes. The exact r and P values of each gene are listed in Dataset EV6 for the upper panel and Dataset EV7 for the lower panel.
- Experimental design for targeting Alu RNAs in a cell culture assay employing SHSY5Y neural cells.
- Expression levels of full‐length Alu RNA (RT–qPCR) in the Alu RNA KD experiment. Statistical significance (P value threshold 0.05) for the comparison between anti‐Alu LNA‐treated samples (anti‐Alu) and samples treated with a scramble control LNA (ctrl) with P = 0.049 and n = 3, unpaired non‐directional t‐test. Error bars represent standard deviation from the mean.
- Expression levels of P53 (RT–qPCR) in the Alu RNA KD experiment. Statistical significance (P value threshold 0.05) for levels in anti‐Alu LNA‐treated samples (anti‐Alu) greater than samples treated with a scramble control LNA (ctrl) with P = 0.046 and n = 3, unpaired directional t‐test. Error bars represent standard deviation from the mean.
- Expression levels (RT–qPCR)_of selected genes from panel A that are either strongly correlated with Alu RNA processing (left, r > 0.5) or only weakly/not correlated (right, r < 0.5). Statistical significance (P value threshold 0.05) for anti‐Alu greater than control (depicted as asterisk, n = 3/group, unpaired directional t‐test, error bars represent standard deviation from the mean). Pearson correlation coefficient for each gene is depicted below the name of each gene.
