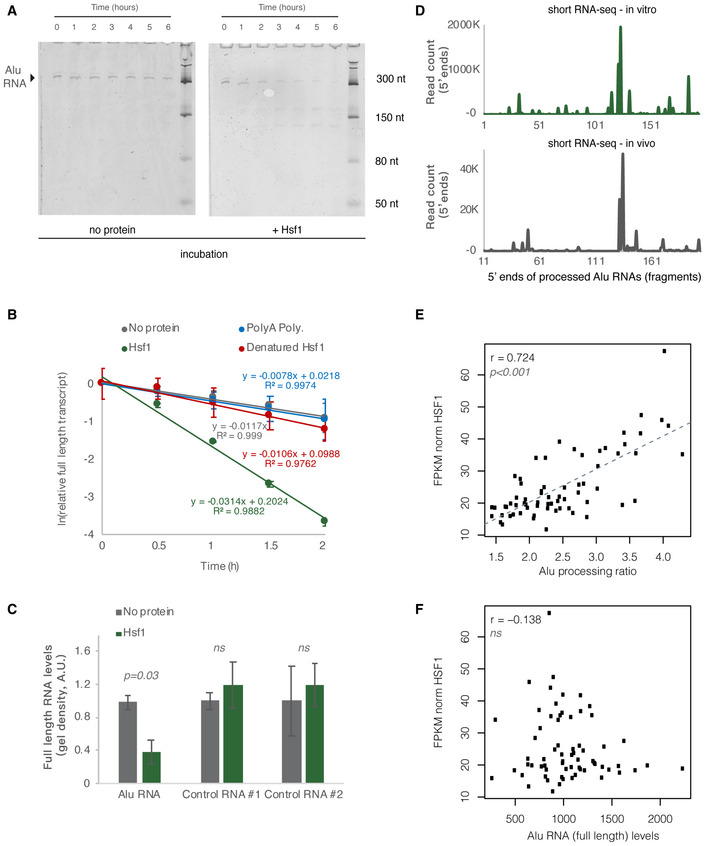
Figure 8. HSF1 accelerates Alu RNA processing in vitro .

- In vitro incubation of one of the Alu RNA consensus sequences for different incubation periods. In vitro transcribed Alu RNA (67 nM) incubated at 37°C with 250 nM HSF1 in the course of 6 h with time intervals of 1 h.
- Comparison among Hsf1 (~ 60 kDa), denatured HSF1, poly‐A polymerase (~ 56 kDa), and no protein (just TAP buffer) with regard to Alu RNA processing (estimating relative full‐length RNA remaining) (two replicates). The full gels are available as Source Data for Fig 8. Relative full‐length RNA remaining was calculated using ImageJ area under the curve software over time. Error bars represent standard deviation from the mean.
- Comparison among Alu RNA (three replicates) and two control RNAs (two replicates) regarding the full‐length RNA levels remaining after in vitro incubation for 90 min at 37°C with HSF1. Sizes of control RNAs are control for RNA #1, 143nt and for control RNA #2, 432nt. Incubation in the absence of HSF1 but presence of the same buffer (TAP) was used as control to take into account any non‐HSF1‐specific RNA destabilization due to non‐specific degradation. Threshold for statistical significance was a P value of 0.05 with P = 0.03 (unpaired, non‐directional t‐test) for the comparison between HSF1 and no protein incubation (n = 3, for Alu RNA). The full gels are available as Source Data for Fig 8. Error bars represent standard deviation from the mean.
- Plotting of the position of the first base (5′ end) of Alu RNA fragments across the Alu consensus sequence produced by Alu RNA that has been processed in vitro for 90 min at 37°C in the presence of HSF1 (upper panel) and compared with one of the in vivo samples of Fig 1 (lower panel). The x‐axis represents an Alu RNA metagene aligned at the start site of the Alu consensus sequence, and the y‐axis shows the 5′ end count for Alu RNA fragments aligning to any position downstream of position +1. The in vivo sample x‐axis depicts a 11nt sift compared to the in vitro one.
- Scatterplot depicting the positive correlation between HSF1 mRNA expression values and Alu RNA processing ratio in MAP AD patients (r = 0.72, P < 0.001). Statistical test is based on Pearson’s product moment correlation coefficient and follows a t distribution using the cor.test function in R package stats.
- Scatterplot depicting lack of correlation between HSF1 mRNA expression values and full‐length Alu RNA levels in MAP AD patients (ns = non‐significant, with P value 0.05 as the significance threshold). Statistical test as in subfigure 8E.
Source data are available online for this figure.
