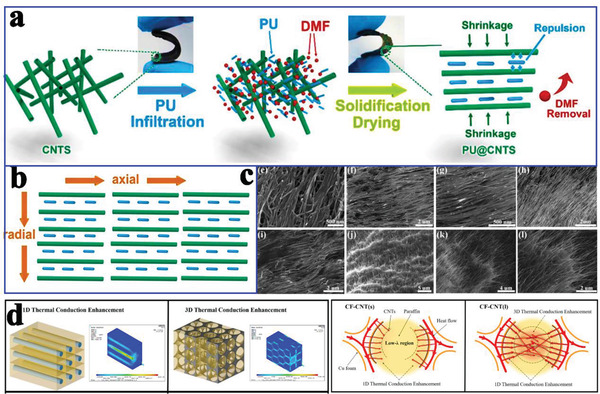
Figure 8.

a) Preparation diagram of PU@CNTs. b) Schematic illustration of thermal conduction in PU@CNTs along the axial and radial directions. c) SEM images of PU@CNTs‐10 from top surface, cross‐section, bottom surface, center, and edge. Reproduced with permission.[ 71 ] Copyright 2019, Elsevier. d) Simulated heat flux field distributions in paraffin‐based composite PCMs and schematic diagram for thermal conduction inside the pores in CF‐CNTs. Reproduced with permission.[ 26 ] Copyright 2019, Elsevier.
