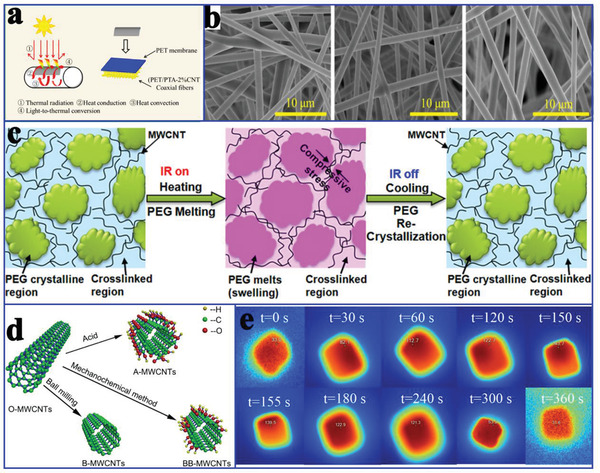
Figure 9.

a) Schematic process for the solar‐to‐thermal conversion. b) SEM images of PET/PTA‐x CNTs coaxial fibers. Reproduced with permission.[ 72 ] Copyright 2019, American Chemical Society. c) Conceptual illustration of the cyclic, dramatic, and reversible electrical conductivity changes. Reproduced with permission.[ 73 ] Copyright 2015, American Chemical Society. d) The ball milling and chemical treatment processes. Reproduced with permission.[ 74 ] Copyright 2018, Elsevier. e) Infrared images of SA/CNTs sponge under the solar irradiation. Reproduced with permission.[ 75 ] Copyright 2018, Elsevier.
