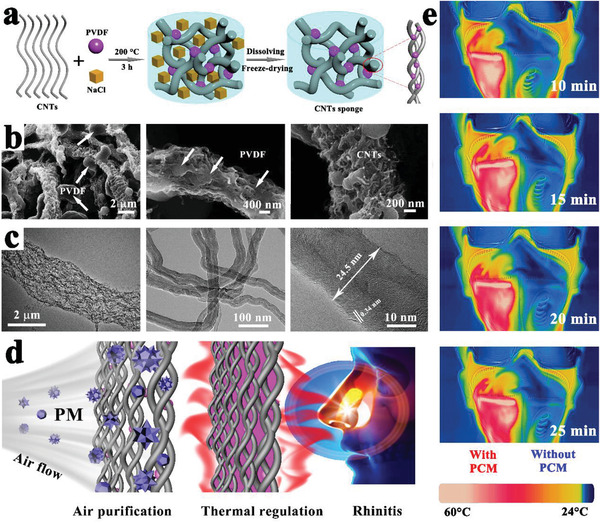
Figure 12.

a) Preparation scheme of CNTs sponge. b,c) SEM and TEM images of CNTs sponge. d) Schematic illustration of the thermotherapy. e) Actual thermotherapy effect evaluation (left is a thermotherapy mask, right is a traditional mask). Reproduced with permission.[ 80 ] Copyright 2020, Elsevier.
