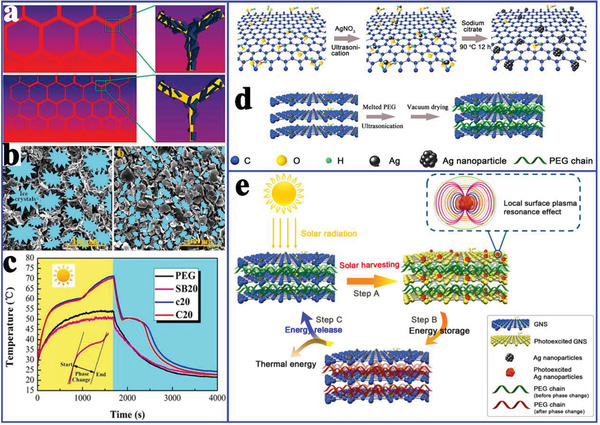
Figure 18.

a) Schematic diagram of the structure and mechanism of different thermal conductivity effects. b) The formation process of 3D porous scaffolds. c) Solar‐to‐thermal energy conversion curves of PEG and composite PCMs. Reproduced with permission.[ 115 ] Copyright 2016, Royal Society of Chemistry. d) Preparation scheme of Ag‐GNS and Ag‐GNS/PEG composite PCMs. e) Schematic illustration of the solar‐to‐thermal energy conversion. Reproduced with permission.[ 106 ] Copyright 2019, Elsevier.
