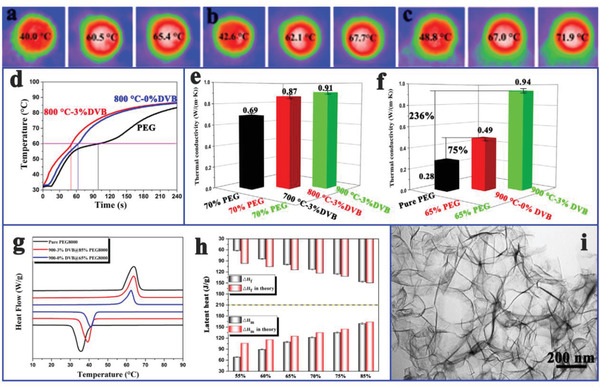
Figure 33.

a–c) Thermal infrared images of various composite PCMs. d) Temperature–time curves of pure PEG and composite PCMs. e,f) Thermal conductivities of pure PEG and composite PCMs. g) DSC curves of pure PEG and composite PCMs. h) Latent heat values of various composite PCMs. i) TEM image of CQDs‐derived porous carbon. Reproduced with permission.[ 24 ] Copyright 2018, Elsevier.
