Figure 2.
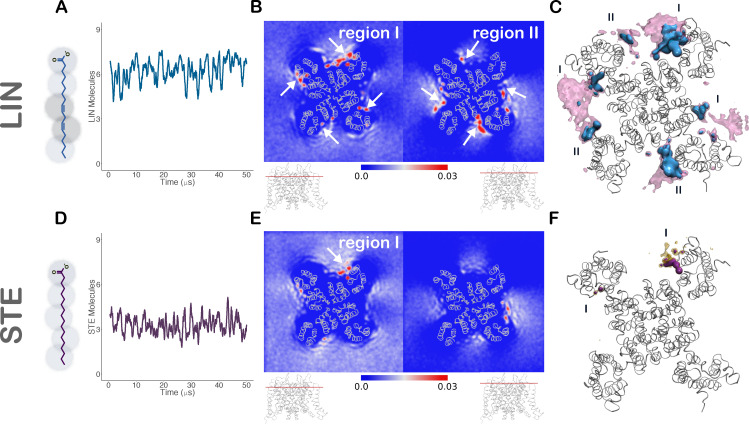
LIN and STE distribution around KCNQ1. (A and D) Left: 2-D structure of LIN (A), an 18-carbon chain with two cis double bonds, and STE (D), a fully saturated 18-carbon chain, overlaid with the Martini CG models of LIN and STE, respectively. Right: Running average over 500 ns of the number of LIN (A) and STE (D) molecules within 6 Å of the channel in the upper bilayer. (B and E) 2-D occupancy maps of LIN (B) and STE (E) head groups around KCNQ1 shown as mean occupancies during the interval of 35–50 µs of the simulation. 0.03 in color scale corresponds to a 3% occupancy (i.e., LIN head group present in 3% of all frames in B). Top-down view of the channel in ribbon representation to clarify LIN (B) and STE (E) enrichment regions. Densities at different layers along the z axis (red line in channel side view below the density maps). Arrows highlight LIN or STE enrichment at regions I and II. (C and F) 3-D contour map of the occupancy of LIN (C) and STE (F) around KCNQ1. Threshold values are set at 15% (mauve or yellow) and 20% (blue or purple) of the total time (a LIN molecule is present in C at least 15% and 20% of the frames, respectively). LIN enrichment regions I and II are indicated in C.

