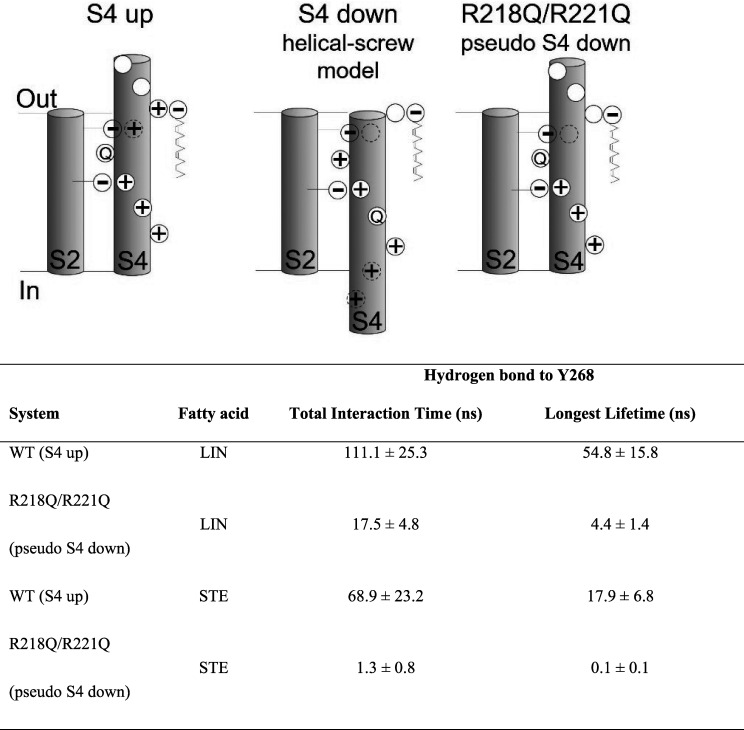
Figure S10.
Numerical values corresponding to Fig. 5, C and D. Top: Schematic illustration comparing the S4 arginine positioning in S4 up, putative S4 down, and R218Q/R221Q (aka pseudo S4 down) states. Bottom: Total interaction time and longest lifetime of hydrogen bonds between LIN and STE head groups and the negatively charged head group of Y268 in 500 ns of AA MD of S4 up (WT) and R218Q/R221Q systems. Data shown as mean ± SEM.

