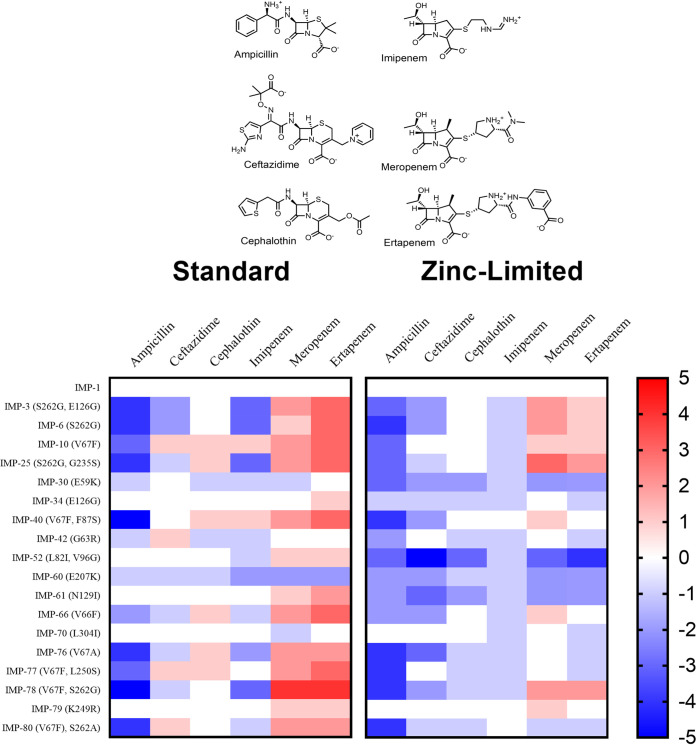
FIG 2.
Heat maps of fold changes in MIC values against a panel of antibiotics representing three structural classes of β-lactams. Heat map intensities for each family represent the fold change in MIC (see Tables S1 and S2) compared to that of the parent family member in standard or zinc-limited conditions.

