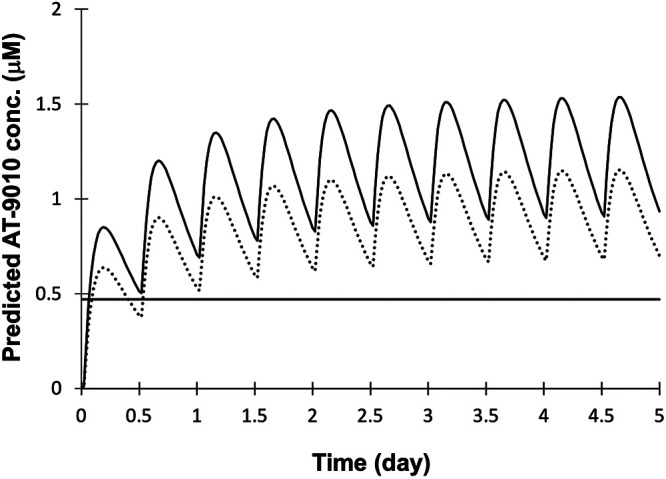
FIG 6.

Simulated AT-9010 concentrations in human lung. Human lung AT-9010 concentrations were predicted for 550-mg BID dosing using published data from subjects given daily 550-mg doses of AT-527 as described in Materials and Methods. The solid curve represents predicted lung concentrations of the active TP metabolite after correcting for the AT-9010 lung-to-liver concentration ratio of 1.6 observed in cynomolgus monkeys at 12 h after the last of 6 BID doses of AT-527 as described for Fig. 4. The dotted curve represents predicted lung concentrations of the active TP metabolite after correcting for the AT-9010 lung-to-AT-273 plasma ratio of 1.2 observed in the same monkeys at the same time point. The horizontal line represents the EC90 of AT-511 against SARS-CoV-2 in HAE cells in vitro (0.47 μM).
