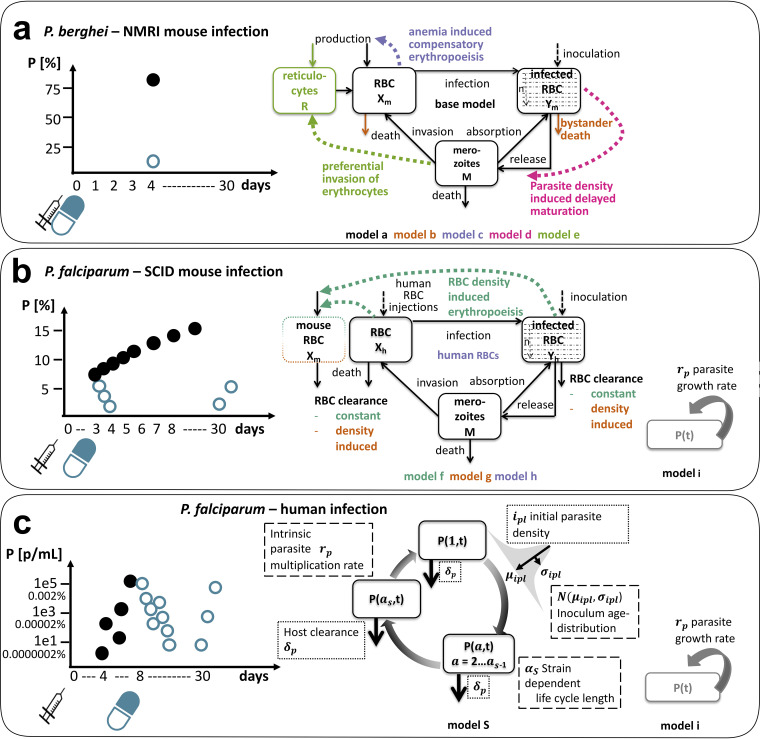
FIG 2.
Experimental sampling design and investigated parasite-host dynamics in preclinical and clinical antimalarial drug development. Parasitemia of a typical subject in each experimental system is shown on the left side. Subjects are inoculated on day 0 (black syringe), and treatment (blue syringe, oral dose) commences on the same day or up to 4 days afterward in murine malaria infection (a, b) and after 7 to 9 days in human infection (c). Each dot represents one measurement, with black dots indicating untreated growth/growth before treatment and blue dots representing parasitemia after treatment. Separate control groups were measured in murine experiments. The murine infections are measured in percent of infected RBCs P (%) (a, b), and human infections are measured in infected RBCs per milliliter P (parasites/ml) (c) (Table 1). For illustrative purposes, we added a conversion of P (parasites/ml) to P (%) in VIS (c) based on the assumption of 5 × 10⁹ RBCs per milliliter in male humans (22). The schematics of mathematical models used to describe parasite growth in the respective system are shown on the right side. (a, b) In murine malaria infection, capturing uninfected (X) and infected (Y) RBC dynamics is crucial to understand implications of resource limitation (P. berghei-NMRI infection) and resource replenishment (P. falciparum-SCID infection) (15). Details on murine model structure can be found in Material and Methods (equations 1 to 6). In contrast, low total numbers of parasites P(t) in P. falciparum-human infection and increased number of measurements shift modeling focus on dynamics of intraerythrocytic parasite stages over time (c). The exponential growth model i can only be used to capture parasite growth of P. falciparum in SCID mouse and human, as data are not informative enough in P. berghei-NMRI infection.

