
FIG 3.
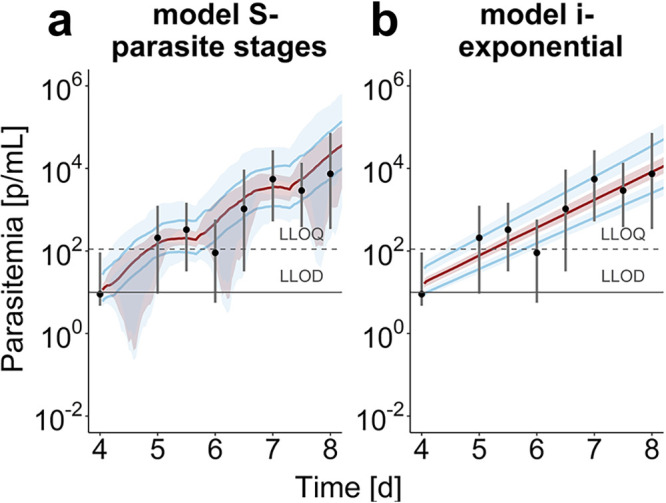
Population parasite growth prediction in VIS. Median parasite densities (black dots) with their 90th percentiles over the time starting 4 days after inoculation for the 177 subjects in VIS (26). Model predictions show the median (red) and 90th percentile (blue) with credible intervals over 100 trials with 20 subjects. (a) The mechanistic growth model S captures parasite growth trends well over time with discrepancies between data and prediction being centered around parasitemia under the lower limit of quantification (LLOQ) of 111 parasites/ml and lower limit of detection (LLOD) of 10 parasites/ml. We found a population posterior median (credible interval) of the initial parasite load (4 days after infection) of 2.59 (2.44 to 2.74) [log(parasites/ml)], a median parasite age μipl of 14.0 h (12.1 to 15.6) with a standard deviation σipl of 4.32 h (3.83 to 4.90). The intrinsic parasite multiplication rate rp of 55.2 (46.3 to 68.5) and death rate δp of 0.0302 (0.0263 to 0.0353) (1/h) describe the intraerythrocytic replication dynamics of the parasite. (b) The exponential parasite growth in model i leads to linear growth behavior on the log-scale and so does not capture the oscillating parasite growth behavior. We estimated a growth rate rp of 0.0649 (1/h) (0.0620 to 0.0678). The posterior predictive checks are illustrated in Fig. S7 (model S) and Fig. S8 (model i) in the supplemental material.