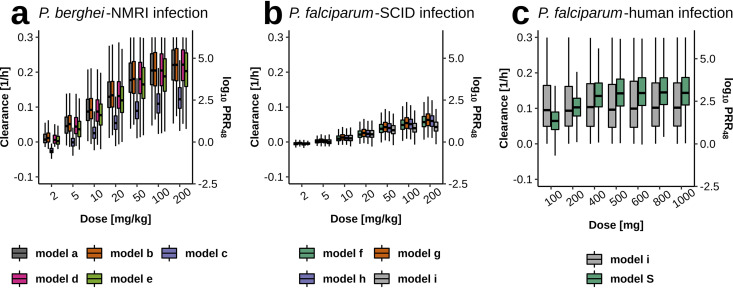
FIG 5.
Parasite clearance across the murine and human experiments after single-dose treatment with OZ439. Within one experimental system, the predicted clearance rates are fairly consistent. (a) Model c (compensatory erythropoeisis) of P. berghei-NMRI infection estimated a lower maximum drug effect Emax resulting in lower clearance rates (see Table S5 in the supplemental material). (b) Compared to panels a and c, P. falciparum-SCID infection shows less variability. (c) The wide clearance range observed in model predictions of the exponential growth model i for P. falciparum-human infection stems from the wide posterior distribution of the maximum drug effect Emax. Parasite clearance rates were calculated from simulation output using the methodology provided previously (49). For comparability, a conversion to log10 PRR48 was added as a secondary y axis where log10 PRR48 = log10(eparasite clearance rate ×48).

