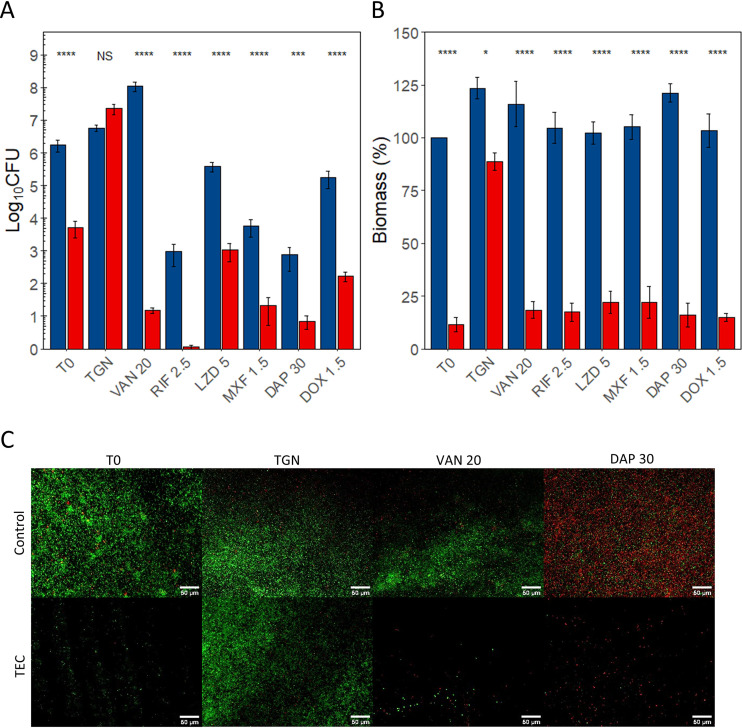
FIG 4.
Effect of the combination of the TEC with antibiotics on MRSE ATCC biofilms. (A) CFU counts. (B) Biomass. (C) Fluorescence microscopy. (A and B) Blue, controls; red, samples treated for 30 min with TEC. T0, no reincubation; TGN, 24 h reincubation in TGN; others, 24 h reincubation in TGN with antibiotics at the indicated concentrations (see Table 1). CFU counts expressed in log10 CFU per coupon, and biomass expressed in percentage of T0 controls. The values indicate the means of triplicate experiments (± standard error). Statistical analysis, two-way ANOVA followed by Tukey HSD comparing control samples to samples exposed to the enzymatic cocktail. NS, no significant difference; *, P < 0.05; **, P < 0.01; ***, P < 0.001; ****, P < 0.0001. (C) Green, living cells (SYTO 9); red, dead cells (propidium iodide). ×20 magnification. Scale bars represent 50 μm. VAN, vancomycin; RIF, rifampin; LZD, linezolid; MXF, moxifloxacin; DAP, daptomycin; DOX, doxycycline.

