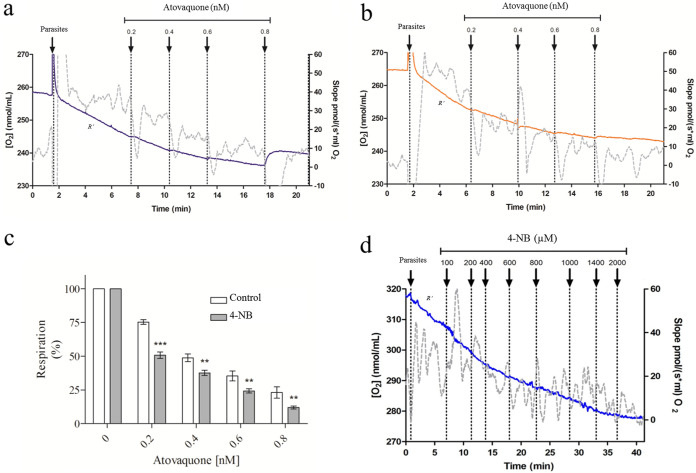
FIG 9.
Respiratory rates in erythrocyte-free parasites. Oxygen consumption was measured in erythrocyte-free parasites. The gray lines indicate the slope variation of oxygen concentration as a function of time (right axis). The blue and orange lines represent O2 concentration (left axis). (a) As a positive control, the parasites were maintained in respiratory buffer. (b) Cultures were treated for 48 h with 4-nitrobenzoate (4-NB). Then, progressive AV doses were added to samples a and b. (c) Respiration percentage: the respiration slopes at specific AV concentrations were normalized by the corresponding R′ slope. Results were analyzed by one-way ANOVA followed by Tukey’s posttest in comparison to the respective control. ***, P < 0.001; *, P < 0.05. (d) Erythrocyte-free parasites were treated with progressive 4-NB concentrations. R′, total cellular oxygen consumption. All experiments mentioned here were performed at least thrice with similar results.

