FIG 4.
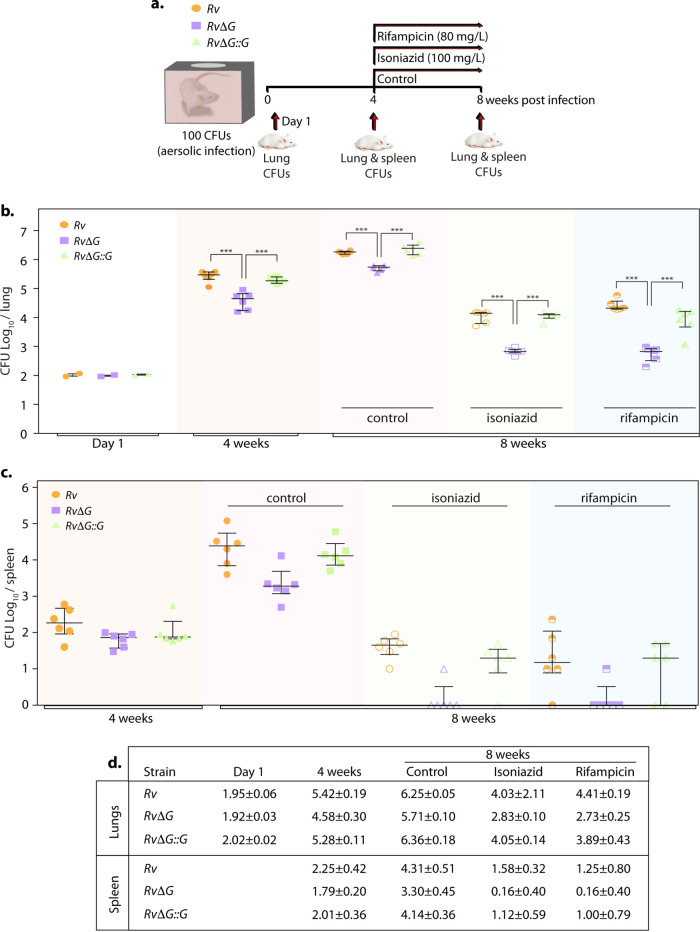
PknG abets drug tolerance in a murine model of tuberculosis infection. (a) Schematic representation of the murine infection experiment. Mice (n = 6 per group at each time point) were infected with Rv, RvΔG, and RvΔG::G. After the establishment of infection for 4 weeks, antibiotics (INH or RIF) were added to drinking water for the next 4 weeks. A parallel group was left untreated (control). Bacillary survival was assessed at day 1 and weeks 4 and 8. (b and c) Bacillary loads in lungs (b) and spleen (c) of infected mice at 4 and 8 weeks postinfection (n = 6). Each data point represents the log10 CFU of an infected animal in individual organs, and the error bar depicts the SD for each group. *, P < 0.05; **, P < 0.005; ***, P < 0.0005. (d) Table depicting mean log10 CFU ± SD in the lungs and spleen of infected animals at the indicated time points.

