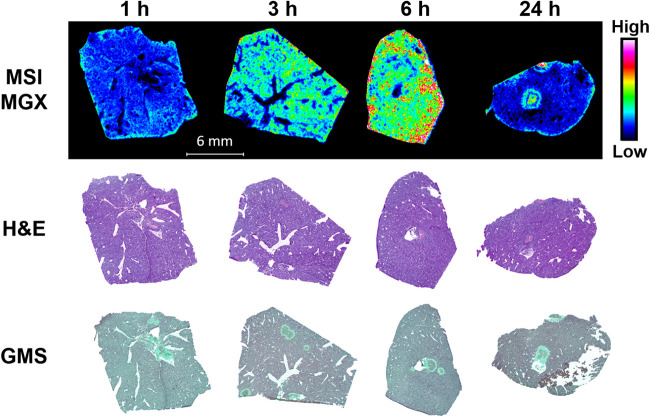
FIG 4.
Spatial distribution of MGX in infected livers after single FMGX dose. Matrix-assisted laser desorption ionization–mass spectrometry (MALDI MS) ion maps of MGX in representative liver tissues collected 1, 3, 6, and 24 h after a single oral dose of FMGX are displayed in the top panel. The hematoxylin and eosin (H&E) stains of the sections utilized for mass spectrometry imaging (MSI) are shown in the middle panel and Grocott methenamine silver (GMS) stains of adjacent sections are displayed in the bottom panel. Bar, 6 mm.

