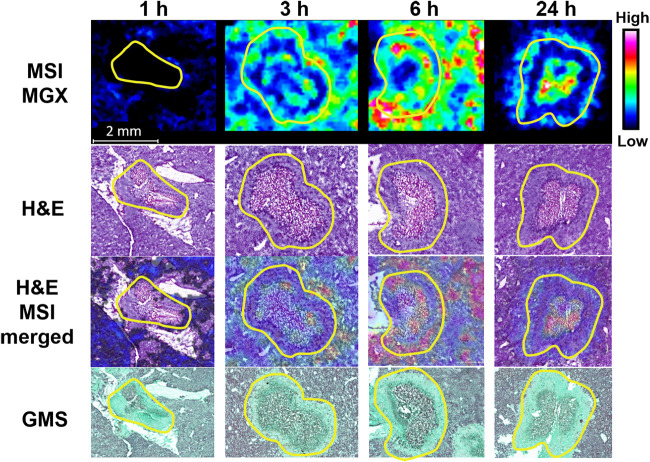
FIG 5.
Enlarged view of individual lesions at 1, 3, 6, and 24 h after single dosing of FMGX. Yellow outlines highlight the lesion area on each tissue section. MALDI MS ion maps of MGX are displayed in the top panel. The H&E stains of the sections utilized for MSI are shown in the second panel. A merged image of the H&E and MSI ion map of MGX is shown in the third panel. GMS staining of adjacent sections are displayed in the bottom panel. Bar, 2 mm.

