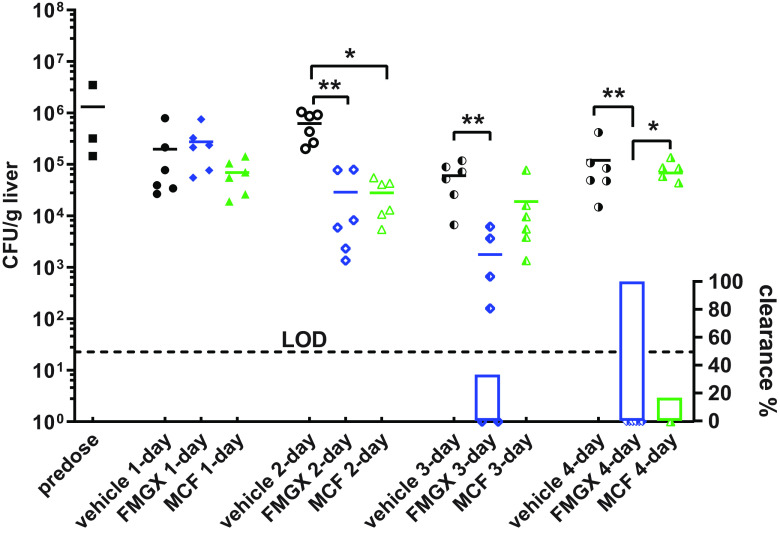
FIG 7.
Liver burden reduction and clearance comparison at predose, 24 h after 1-, 2-, 3-, and 4-day treatments of FMGX, MCF, and vehicle control. The dotted line is the limit of detection (LOD) at 22.7 CFU/g. Symbols on the x axis represent mice with no recoverable liver burden (clearance). The percentages of mice with liver burden clearance are plotted as bars on the right y axis underneath burdens of each corresponding group. The significant burden differences are labeled as * (P < 0.05) and ** (P < 0.01).

