
FIG 4.
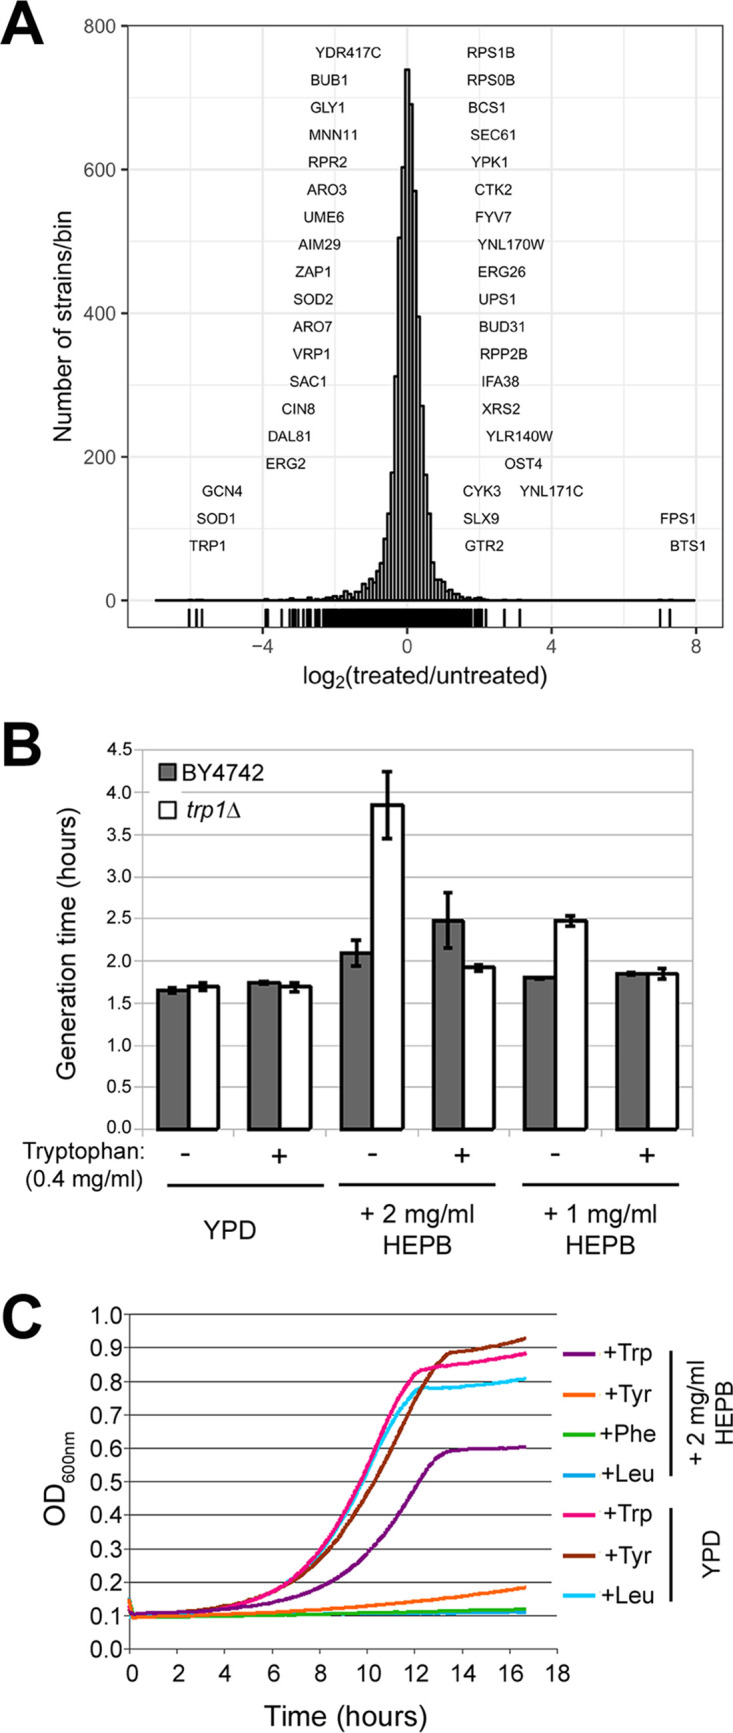
Phenotypic profiling in S. cerevisiae links HEPB mode of action to tryptophan availability. (A) Histogram depicting the relative abundance of each group of S. cerevisiae mutants (histogram bins) measured as the log2-transformed ratio of barcode signal intensity in HEPB-treated samples (n = 3) compared to untreated control sample (x axis). The number of strains per histogram bin are shown on the y axis. Mutants with significantly decreased abundance following HEPB treatment are shown on the left part of the histogram, whereas those with increased relative abundance are shown on the right part of the histogram. (B) Parental BY4742 (gray bar) and the trp1Δ mutant derivative (white bar) were grown in the absence (−) or presence (+) of 0.4 mg/ml tryptophan in YPD medium (YPD) supplemented (+2 mg/ml HEPB, +1 mg/ml HEPB) or not (YPD) with 2 mg/ml or 1 mg/ml HEPB. Generation times (in hours) of each strain under each condition are indicated on the y axis calculated as the mean of 3 independently grown cultures with error bars denoting standard deviations. (C) Growth curves of the trp1Δ mutant grown in YPD medium (YPD) or in YPD medium supplemented with 2 mg/ml HEPB (+2 mg/ml HEPB) are depicted in different colors depending on the identity of the amino acid being added to the growth medium. Turbidity (OD600, y axis) was recorded every 5 min as a function of time (hours, x axis) in a Tecan Sunrise device.