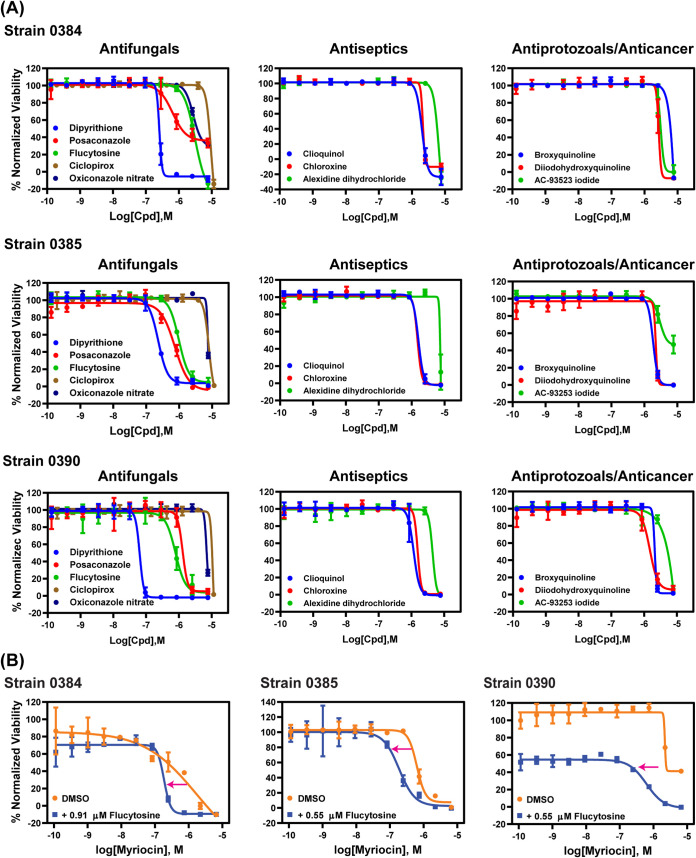
FIG 2.
Concentration-response curves. (A) Concentration-response curves of compounds with pan-activity for all tested strains. Each data point is presented as mean ± standard deviation (SD) for three independent experiments. (B) Concentration-response curves of myriocin with or without flucytosine. Each data point is presented as mean ± standard deviation (SD) for two experiments.

