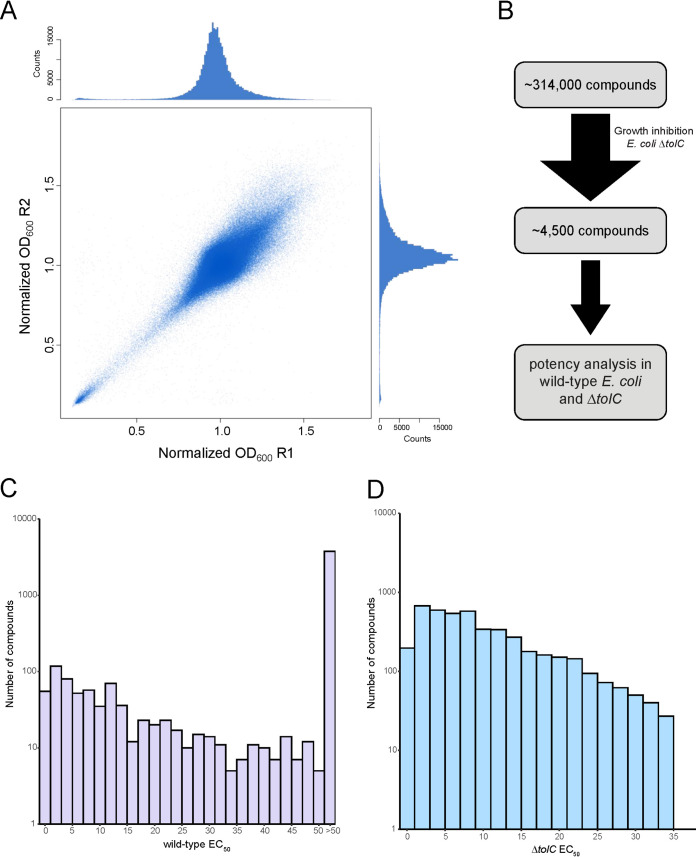
FIG 1.
Primary small-molecule screen and potency analysis of actives. (A) Replicate plot of the primary screen of ∼314,000 small molecules in the efflux-deficient mutant strain E. coli BW25113 ΔtolC. Data were normalized as per Mangat et al. (47) and show good reproducibility. Density distributions are depicted in secondary plots for each of the two replicates. (B) From this primary screen, ∼4,500 actives exhibited strong growth inhibition (≤3σ below the mean [a molecule with a normalized mean OD value of ∼0.5 or less was deemed a growth inhibitor]) against the mutant strain E. coli BW25113 ΔtolC. The potency of these 4,500 actives was measured in wild-type E. coli BW25113 and the mutant strain E. coli BW25113 ΔtolC. A histogram shows the measured potency values obtained from dose-response analyses in (C) wild-type E. coli BW25113 and (D) the mutant strain E. coli BW25113 ΔtolC.

