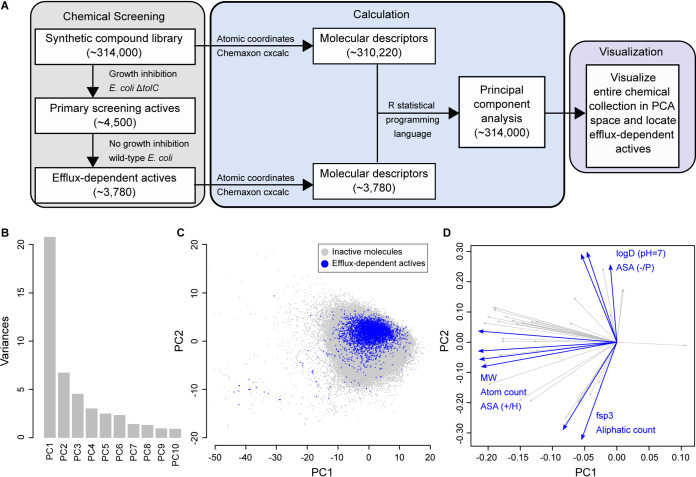
FIG 2.
Principal-component analysis of molecular descriptors of efflux-dependent actives and non-growth-inhibitory molecules from the primary screen. (A) Molecular descriptors for each efflux-dependent active and the remaining screened compounds were calculated. The former set and all non-growth-inhibitory molecules from the primary screen (inactive molecules) were visualized using a principal-component analysis (PCA). (B) Ten principal components (PC) explaining variances between descriptors of efflux-dependent actives and those of inactive molecules are shown. The first 3 principal components, PC1, PC2, and PC3, explain ∼63% of these variances. (C) For visualization, the first two principal component scores are presented, where efflux-dependent actives occupied a distinct chemical space (blue) among the inactive molecules (gray). (D) The loading eigenvectors for this PCA plot are shown. The molecular descriptors contributing the most to the scores of PC1 and PC2 are highlighted in blue: molecular weight (MW), atom count, accessible surface area (ASA) of partial negative charge (−), polar atoms (P), partial positive charge (+), hydrophobic atoms (H), the fraction of sp3 hybridized carbon atoms (Fsp3), and aliphatic count. Descriptors with lower contributions are shown in gray.

