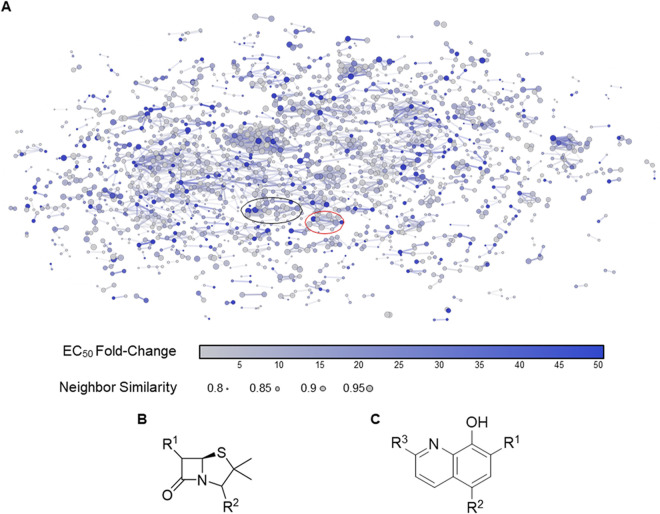
FIG 6.
Structure-activity representation of the 4,500 actives from the primary screen. (A) Small molecules were clustered by structural similarity with fragment-based fingerprints in DataWarrior (50), using a force-directed method of clustering within the 2D space shown. Several clusters containing >15 molecules (neighbors) are seen from the primary screening data. The points are colored by a fold change in EC50 between wild-type E. coli strain BW25113 and the mutant strain BW25113 ΔtolC. The sizes of the points indicate the structural similarity between a compound and its immediate neighbors. The locations of the β-lactam cluster (black oval) and the hydroxyquinoline derivative cluster (red oval) are highlighted. Structures of the common core for the (B) β-lactam cluster and (C) the hydroxyquinoline derivative cluster are shown.

