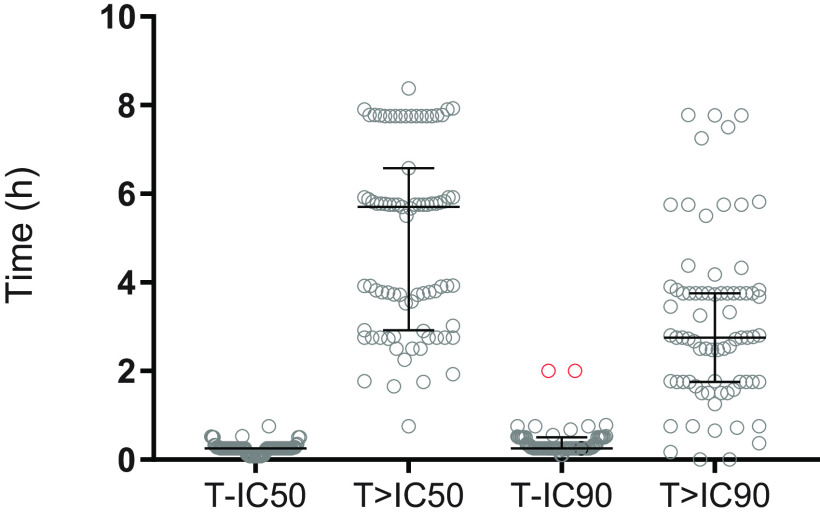
FIG 3.
Graphical representation of time to putative IC50 (T-IC50), time above IC50 (T>IC50), time to putative IC90 (T-IC90), and time above IC90 (T>IC90) after rectal artesunate administration. Concentrations were measured as the sum of molar artesunate and dihydroartemisinin concentrations. Markers represent individual values and lines represent the median value and its interquartile range. The graphic shows only data for patients who reached the cutoff (IC50 or IC90). One patient did not reach IC50. The red dots indicate the 2 cases with a longer time to reach IC90.

