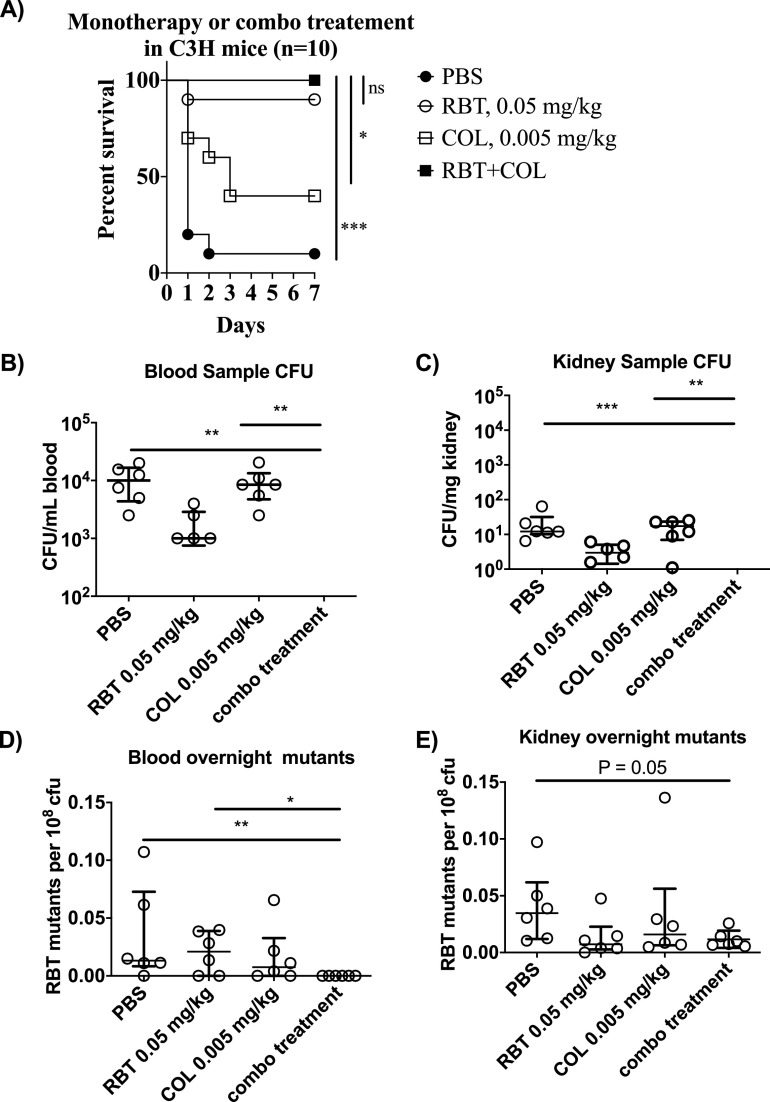
FIG 3.
Efficacy of rifabutin colistin combination treatment in vivo. (A) C3HeB/FeJ mice (n = 10 per group) were infected with 1.2 × 10⁷ to 3.9 × 10⁷ CFU of the hypervirulent (100% lethal dose [LD100] < 2 × 10⁷ CFU) carbapenem-resistant A. baumannii HUMC1 (9, 10) and treated with PBS, 0.05 mg/kg RBT, 0.005 mg/kg COL, or a combination of RBT and COL. There was a significant difference comparing the RBT+COL group to the PBS (<0.001, log rank) and COL monotherapy groups (0.0113, log rank). There was no significant difference between the combination treatment group and the RBT monotherapy group. (B) C3HeB/FeJ mice (n = 6 per group) were infected with 5 × 10⁷ CFU of A. baumannii HUMC1. Mice were treated once after infection with PBS, 0.05 mg/kg RBT (subtherapeutic), 0.005 mg/kg COL (subtherapeutic), or RBT + COL. Blood and kidney samples were collected 24 h postinfection and kidneys were weighed and homogenized. Blood (B) and kidney (C) homogenates were enumerated on TSA plates and results were recorded. No CFU were observed for the RBT + COL treatment group in the blood and kidney homogenate. In the blood, there was a significant difference between RBT + COL combination compared to PBS (Kruskal-Wallis, P = 0.001) and COL (Kruskal-Wallis, P = 0.001). In the kidneys, there was a significant difference between RBT + COL combination compared to PBS (Kruskal-Wallis, P = 0.0006) and COL (Kruskal-Wallis, P = 0.001). (D) 100 μl blood and (E) 100 μl kidney homogenates were used to inoculate 10 ml of TSB, the outgrowths from the overnight cultures were serially diluted and plated on drug and nondrug TSA plates, and the frequencies of resistant mutants were enumerated. In the outgrowth from the blood sample, there was a significant difference between RBT + COL combination compared to PBS (Kruskal-Wallis, P = 0.008) and RBT (Kruskal-Wallis, P = 0.026). In the outgrowth from the kidney sample, there was a notable but not significant difference between RBT + COL and PBS (Kruskal-Wallis, P = 0.05). The median and interquartile range were plotted for all graphs.

