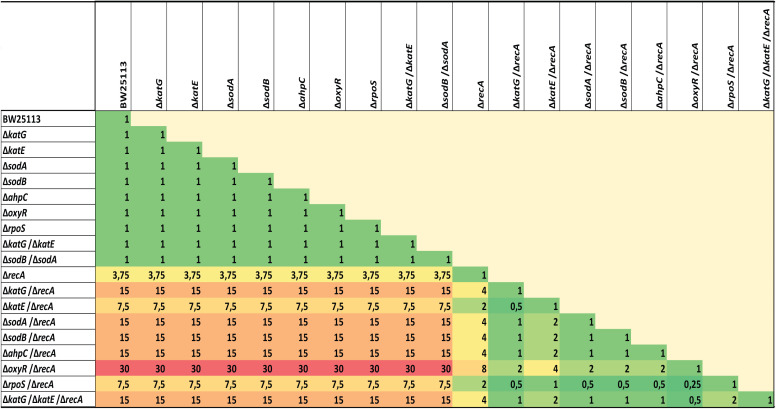
TABLE 1.
Heat map of the fold decrease in ciprofloxacin MICs of different recA and detoxification system inactivationsa
MIC values represent the means of at least three independent determinations performed on separate days. The raw MIC values of all strains are shown in Table S1 in the supplemental material.

