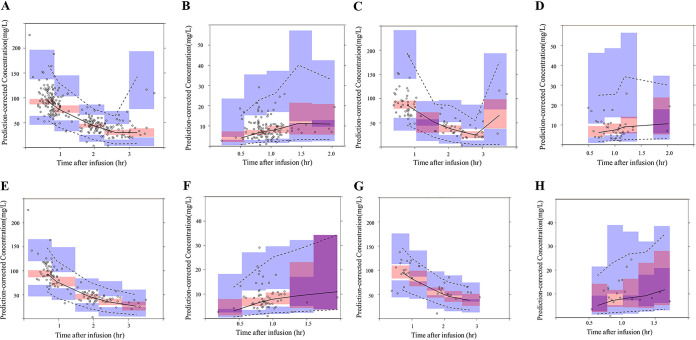
FIG 3.
(A and B) Visual predictive check based on the final population pharmacokinetic of the serum (A) and hip joint capsule (B). (C and D) In subjects with normal renal function (CLcr ≥ 90 ml/min), serum (C) and hip joint capsule (D). (E and F) In subjects with moderate renal impairment (CLcr 50 to 90 ml/min), serum (E) and hip joint capsule (F). (G and H) In subjects with severe renal impairment (CLcr < 50 ml/min), serum (G) and hip joint capsule (H). The solid and dotted lines are median profiles and 90% predicted intervals (PIs).

