
Figure 3. Disease Activity by Disease Subgroup.
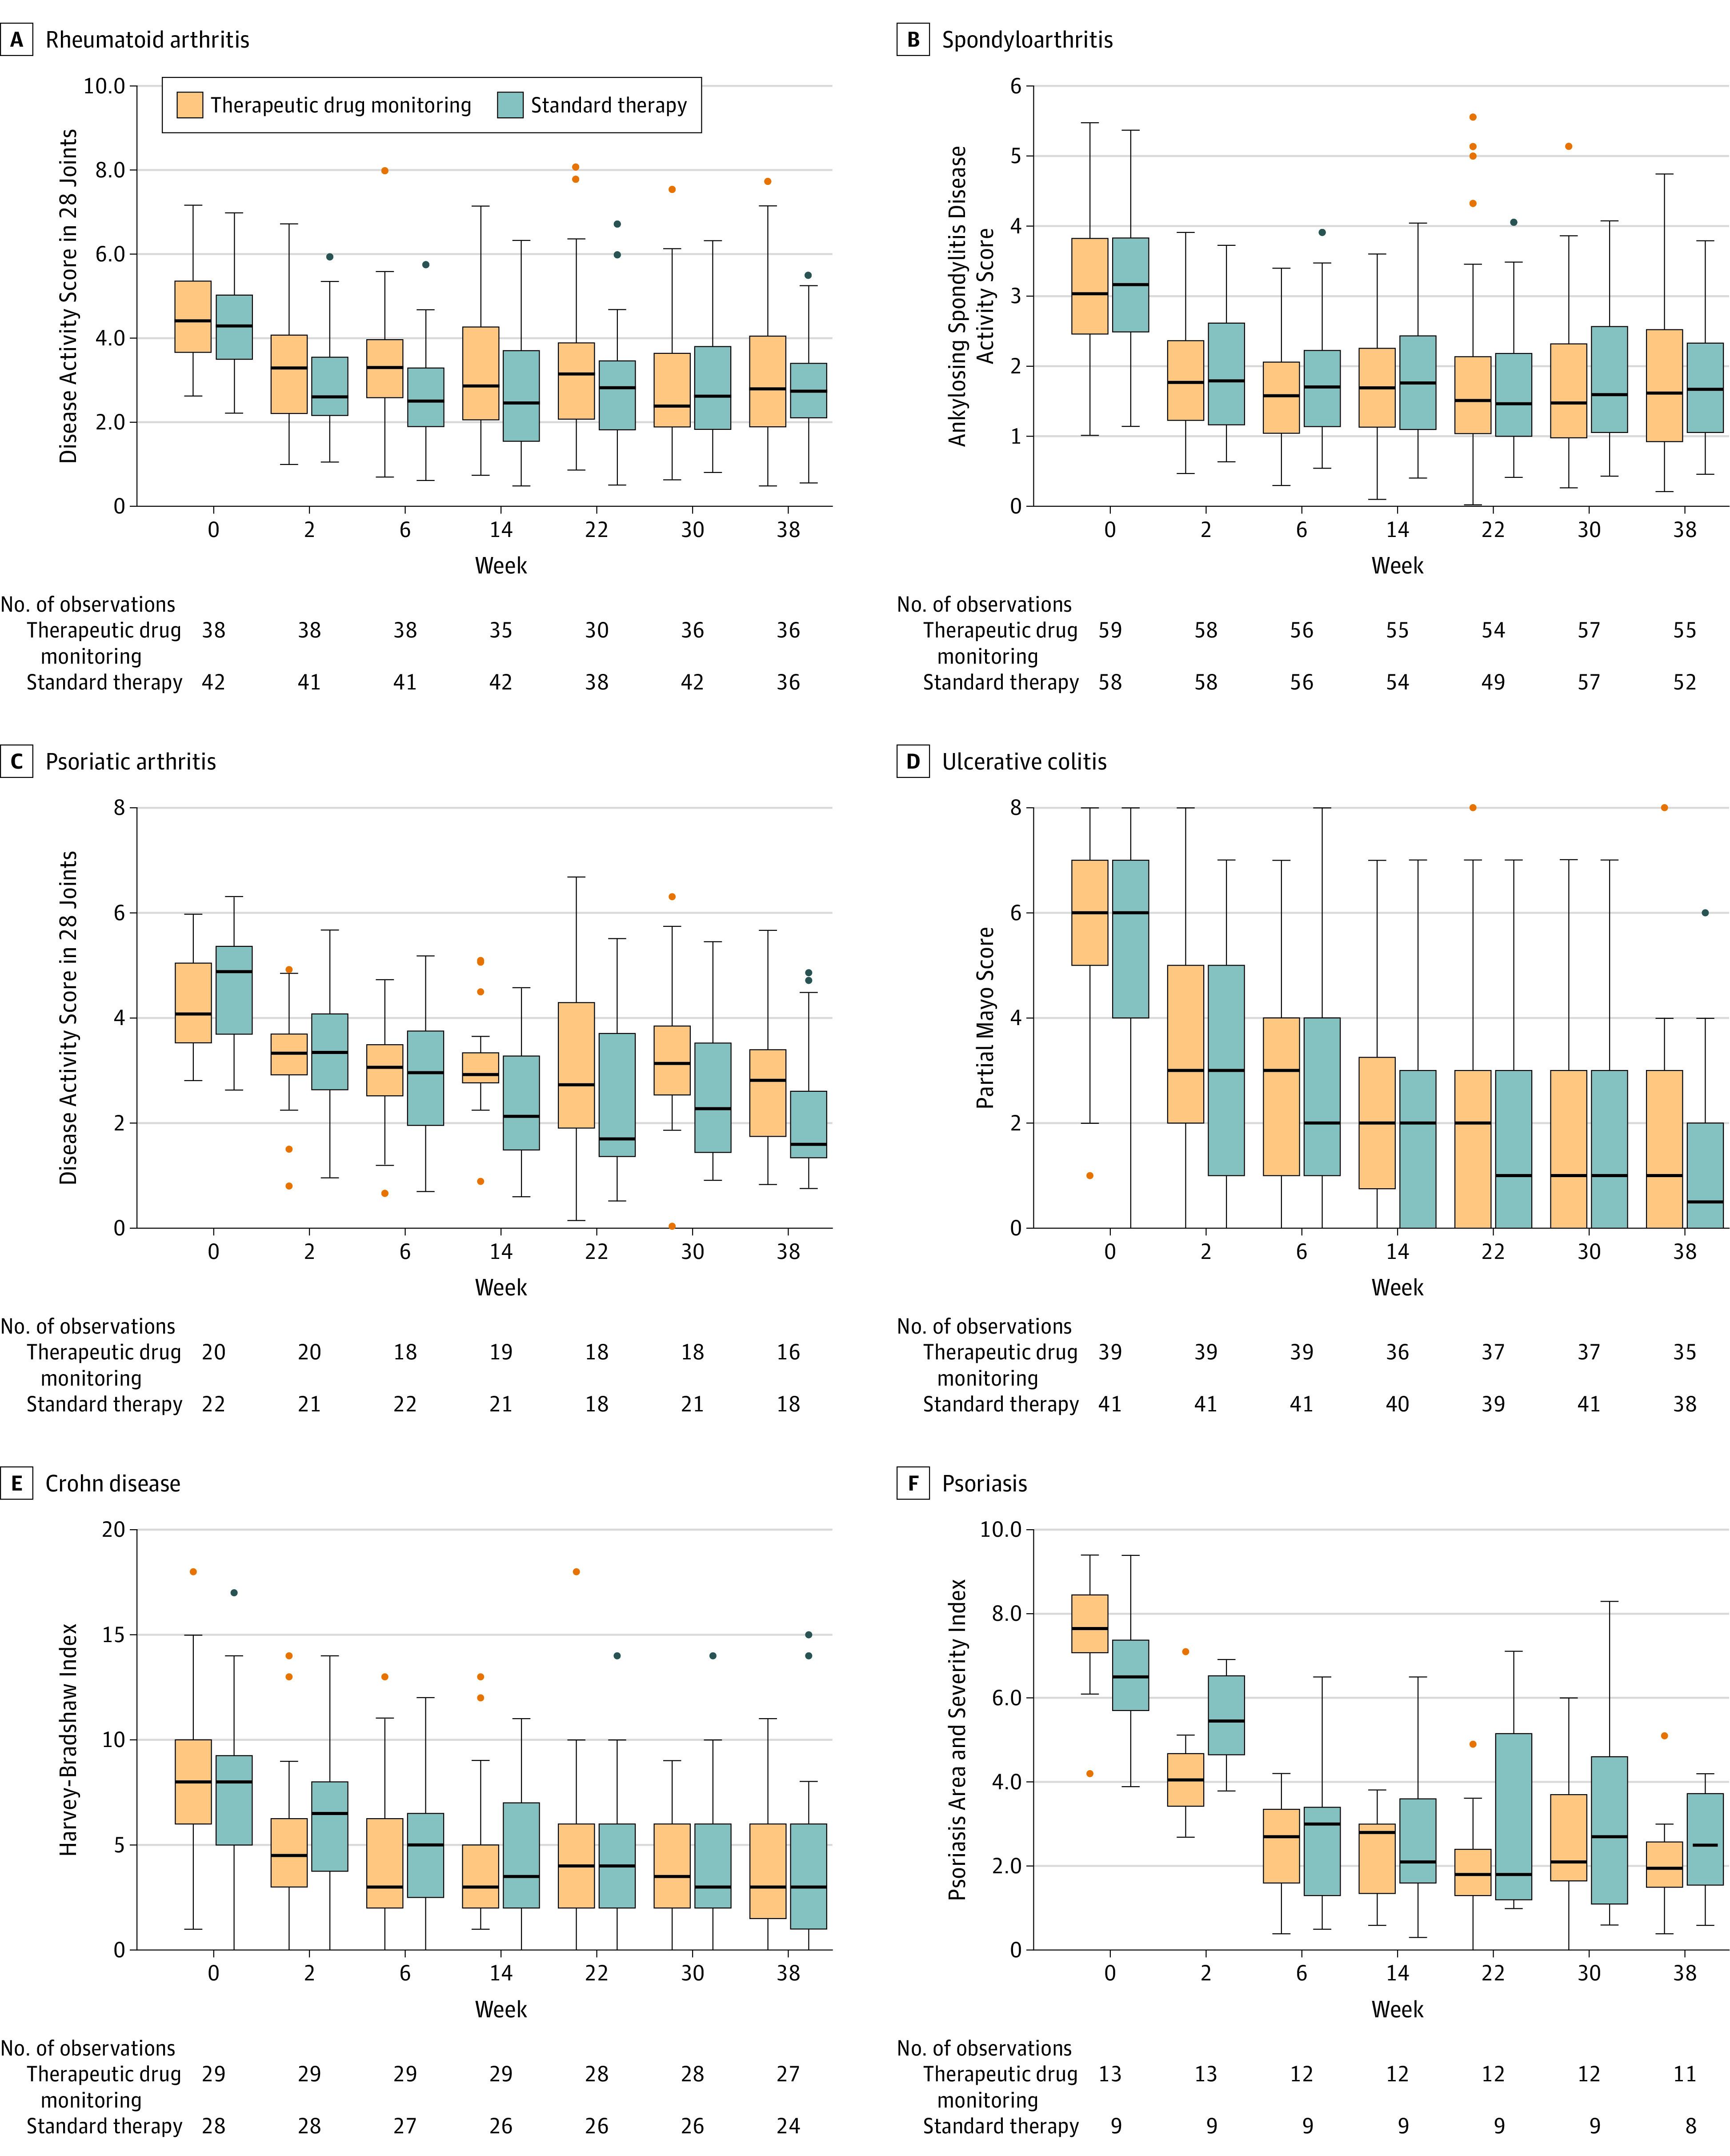
Orange indicates therapeutic drug monitoring; blue, standard therapy. Box tops and bottoms indicate interquartile range; horizontal bars inside boxes, median; whiskers, highest and lowest values within 1.5 × the interquartile range. Dots indicate individual patient outliers. See the Box and eTable 3 in Supplement 1 for detailed descriptions of the Disease Activity Score in 28 Joints, Ankylosing Spondylitis Disease Activity Score, Partial Mayo Score, Harvey-Bradshaw Index, and Psoriasis Area and Severity Index.