Figure 1.
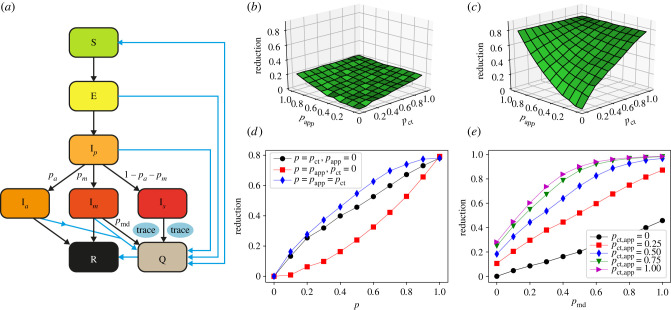
Model and impact of contact tracing on the epidemic size. (a) Schematic illustration of the investigated epidemic model. (b) Relative reduction in the average epidemic size as a function of MCT probability pct and app adoption rate papp, with respect to the situation of only case isolation, with pmd = 0.5, for OD, with θct = θapp = 15 min. Here , τdct = 0. (c) The same for SD (threshold θct = θapp = 15 min). (d) Same as (c), for three slices: along the pct axis with papp = 0, along the papp axis with pct = 0 and along the diagonal pct = papp. (e) Relative reduction as a function of the testing and diagnosis rate of mildly symptomatic pmd, for the SD with various values of pct = papp.

