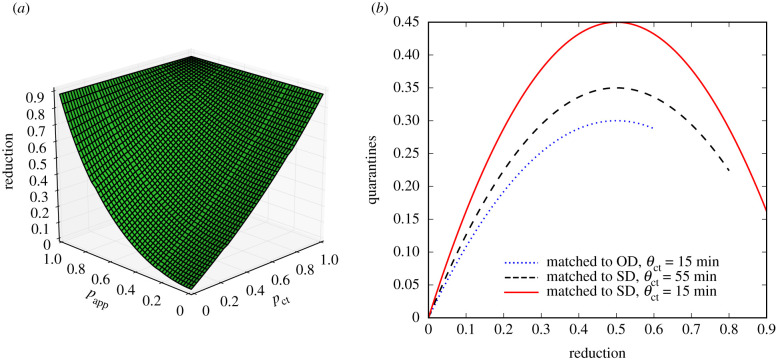
Figure 3.
Results reproduced with simplified theoretical models. (a) Reduction in final epidemic sizes as a function of MCT probability pct and app adoption rate papp. For easier comparison with the simulation results, we have matched the parameters such that the epidemic sizes at papp = pct = 0 and papp = pct = 1 are the same as for the SD data shown in figure 1c. The overall shape of the surface is very similar, with MCT leading to an almost linear reduction while the app adoption leads to a convex shape. (b) Number of quarantine events normalized by the population size as a function of epidemic size reduction, obtained by the simple mathematical argument explained in the main text. The height of the curve depends on the parameters and the end of the curve is determined by the maximum reduction in epidemic size. For easier comparison with figure 2c, we matched the heights and the maximum reductions to those of the simulation results.

