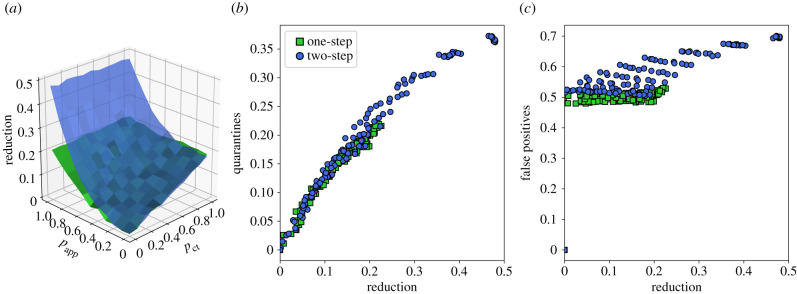
Figure 4.
Recursive contact tracing versus single-step contact tracing. (a) Blue surface: epidemic size reduction as a function of MCT probability pct and app adoption rate papp for recursive tracing (blue) and single-step tracing (green) for reference, for the OD dataset. θct = θapp = 15 min. (b) Normalized number of quarantine events versus epidemic size reduction for recursive (‘two-step’, blue) and single-step tracing (green). (c) Proportion of non-infected quarantined individuals for the same cases.

