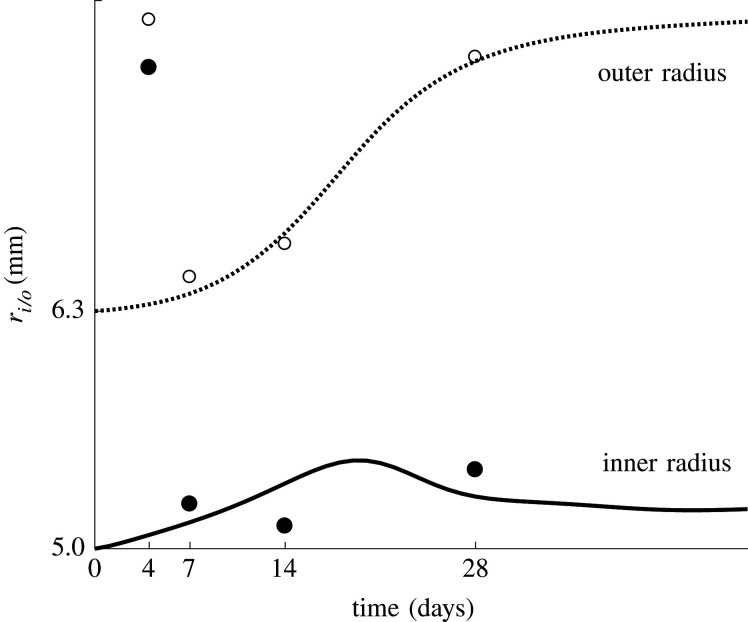
Figure 7.
The inner radius (solid line and filled dots) and outer radius (dotted line and open dots) of the iliac artery through time. The lines represent the predicted radii, while the dots represent the experimental data as the mean value of measurements in four to six animals [27].

