
Figure 6.
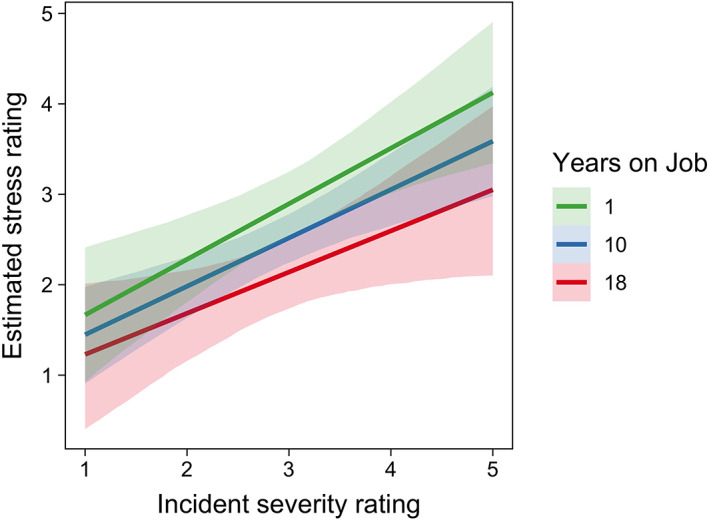
The relation between participants' stress ratings (y‐axis), the coder's rating of event severity rating (x‐axis) and years on job. Lines and shades indicate regression lines and 95% CIs, respectively, from multilevel regression model [Color figure can be viewed at wileyonlinelibrary.com]